
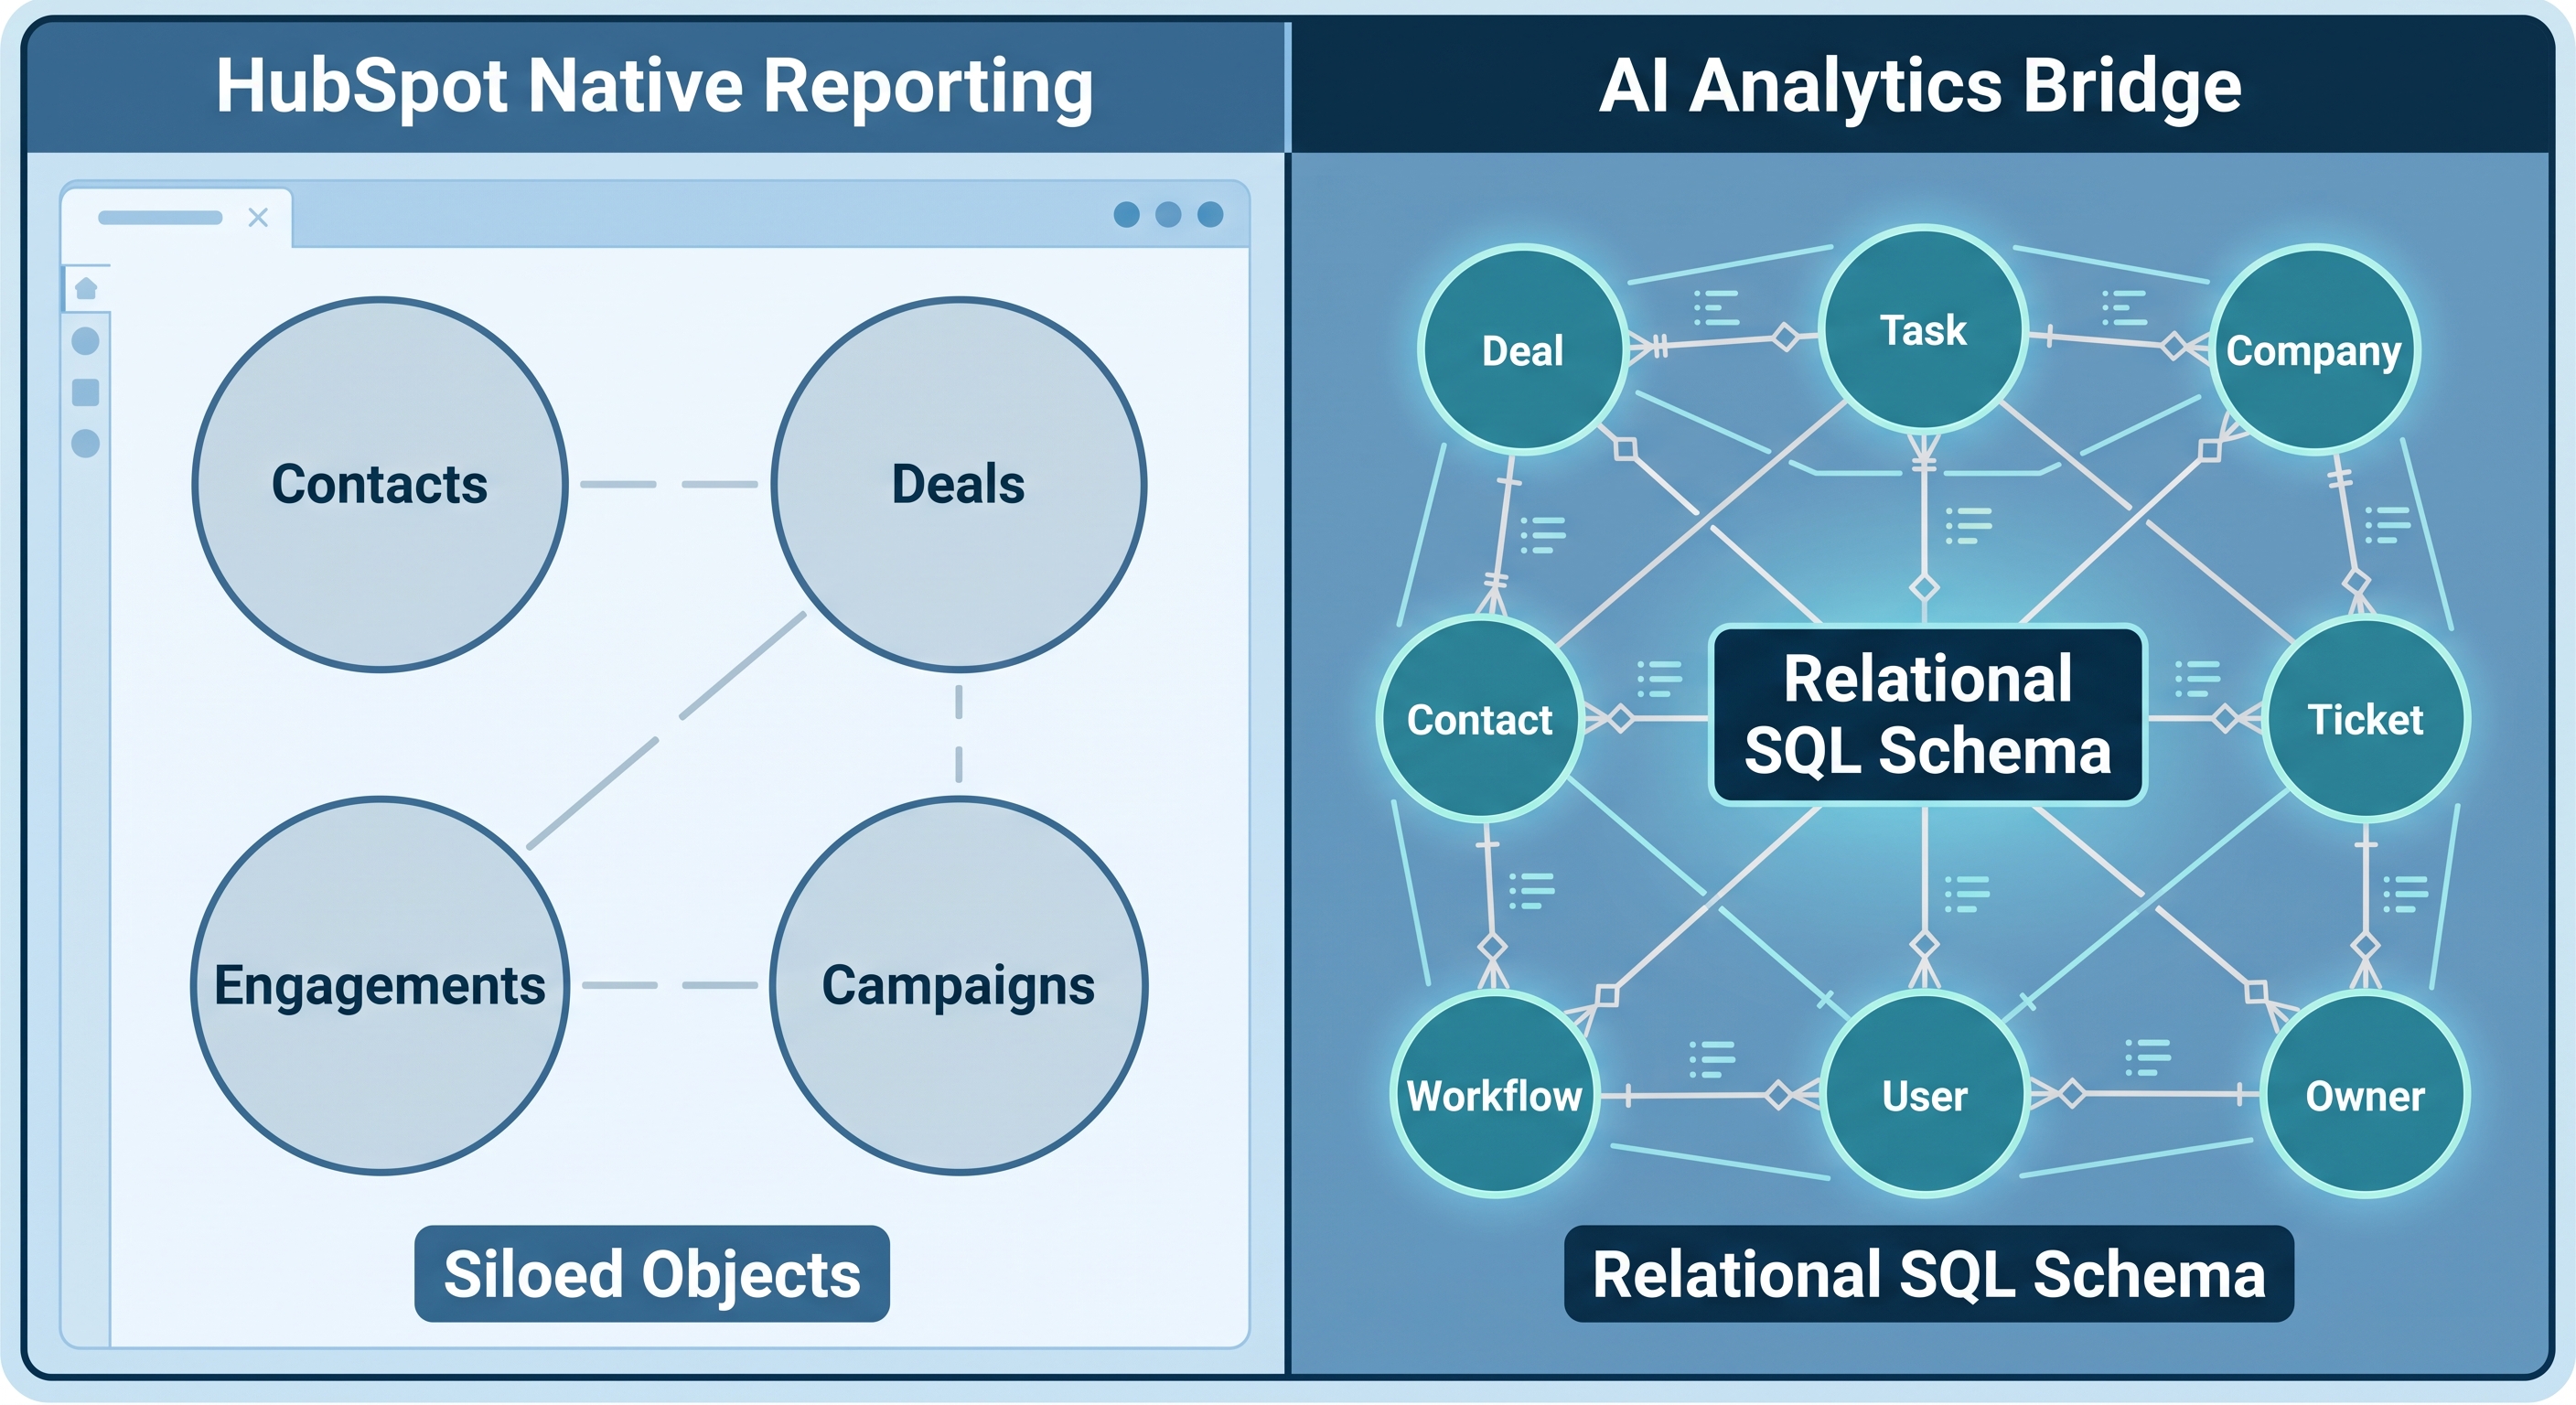
Every quarter, a sales manager somewhere builds the same leaderboard in a spreadsheet. Copy deal data from HubSpot, paste into Excel, write a RANK formula, format it, and send it to the team before the quarterly business review (QBR). They upgraded to HubSpot Enterprise expecting native benchmark comparisons. The upgrade did not deliver them.
The problem is not a missing feature scheduled for a future release. It is a structural constraint in how HubSpot's reporting engine computes results - a constraint that applies equally at every pricing tier, including Enterprise. Once you understand what window functions are and why they require a different kind of query engine, the limitation becomes clear and the workarounds become predictable: export to Excel, build a shadow database, or license a separate Business Intelligence (BI) tool.
This post explains what the gap is, which questions fall into it, and how DataLabs.store closes it.
What HubSpot's Report Builder Actually Computes
HubSpot's Custom Report Builder, available at the Enterprise tier, lets you pull data from up to five associated object types in a single report. That is a genuine capability improvement over the single-object filter most teams start with. But no matter how many objects you connect, the computation model stays constant: HubSpot aggregates rows (count, sum, average, minimum, maximum) and then lets you group, filter, and sort those aggregates.
The operation it does not support is using one aggregate as input to another computation within the same query. You can ask HubSpot: "What is the average deal size for each rep?" You cannot ask: "For each rep, how does their average deal size compare to the median across all reps, and where do they rank?" The second question requires the result of the first to be available as a value in the same pass - and HubSpot's reporting engine does not allow that.
What Window Functions Do
Window functions in SQL compute a value for each row in a result set while also consulting other rows that share a defined characteristic, called a partition. The function "sees through" the partition to include context from related rows without collapsing them into a single aggregate.
Three patterns come up repeatedly in sales and Revenue Operations (RevOps) reporting:
Ranking within a group: A RANK function partitioned by region and ordered by average deal size assigns each rep a rank within their region. Every rep keeps their own row. No data is collapsed. The rank appears as a column alongside each rep's individual metrics.
Percentile position: A PERCENT_RANK function applied to support ticket counts tells you where each account sits in the overall distribution. A value of 0.75 means 75 percent of accounts have fewer tickets than this one.
Period-over-period comparison: A LAG function applied to win rate pulls the prior period's value for each rep into the current row, making trend comparison a straightforward column calculation rather than a self-join or subquery.
None of these patterns exist in HubSpot's report builder. The builder can compute aggregates over rows; it cannot compute a function over a set of already-computed aggregates in the same query. This is the aggregate-of-aggregates gap - and it affects every HubSpot plan, including Enterprise.
Three Questions That Hit the Wall
These are the benchmark questions Revenue Operations and sales leadership teams most commonly take to a spreadsheet after exhausting the native report builder:
| The Question | What You Actually Need | What HubSpot Returns |
|---|---|---|
| Rank each rep by average deal size vs the team median | Each rep's average deal size, the team median, the gap from median, and a rank within the team | Each rep's average deal size as a standalone figure, no comparison and no rank |
| Flag accounts above the 75th percentile for open support tickets | Percentile rank of each account's ticket volume, with a threshold flag for above-benchmark accounts | Ticket count per company, no percentile computation, no flag |
| Show each rep's rolling 90-day win rate vs the prior 90-day period | Win rate per rep per rolling window, the delta from the prior period, and trend direction | Static win rate since a fixed start date, no rolling window, no period-over-period delta |
The spreadsheet workaround for each of these takes between 30 minutes and two hours per QBR cycle, depending on how many territories have changed and how fresh the data needs to be. The result is also disconnected from the live CRM the moment the export happens - which matters most for rolling win-rate analysis, since closed-won and closed-lost status can change after a deal's initial close date.
A Concrete Example: Pipeline Velocity with Stage Benchmarks
The clearest demonstration of what becomes possible once HubSpot data lives in a real SQL database is this pipeline velocity ranking. The question asked: for each open deal, how many days has it been in its current stage, and how does that compare to the historical average for that stage? Sort by deals aging the most relative to their normal pace.
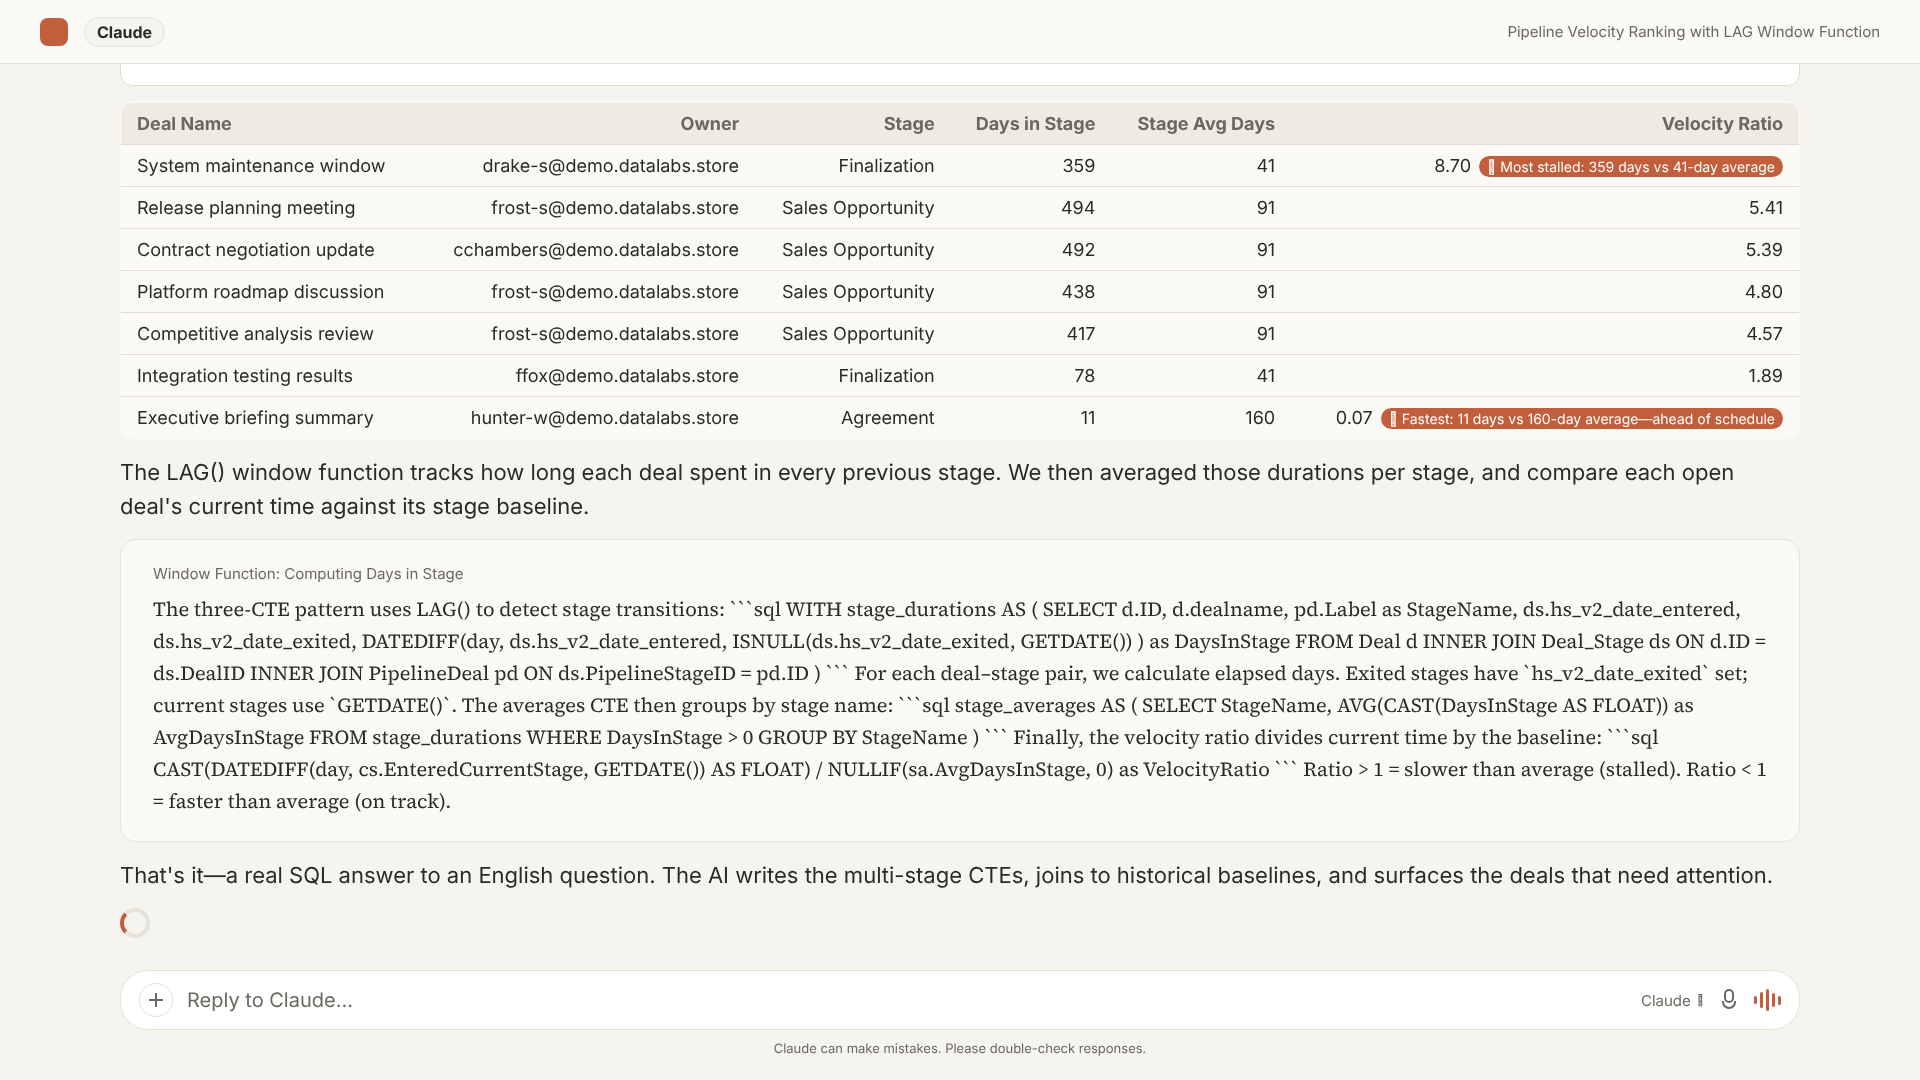
The SQL behind this result uses three Common Table Expressions (CTEs). The first applies a LAG function to the deal stage history table to compute how long each deal spent in each stage. The second averages those durations by stage name to establish a per-stage baseline. The third identifies each deal's current stage. The final query joins open deals to both CTEs and computes a velocity ratio: days currently in stage divided by the historical average for that stage.
The result table shows a velocity ratio for every open deal. A ratio of 4.1 means the deal has spent more than four times longer in its current stage than the historical average. Stage-rot, visible and ranked by severity, surfaced in a single query.
HubSpot cannot produce this output. There is no equivalent to the stage history join, no LAG function in the report builder, and no way to divide a deal's current stage duration by the computed average for that stage in the same query.
How AI Context Bridge for HubSpot Closes the Gap
AI Context Bridge for HubSpot syncs your HubSpot CRM into a real Microsoft SQL Server database via OAuth and then exposes that database to Claude or ChatGPT through a Model Context Protocol (MCP) endpoint. A sales manager or RevOps analyst can ask a plain-English question in their AI chat interface and receive back a ranked result table, with the SQL that produced it visible underneath.
The workflow for the rep-ranking use case looks like this:
- Connect HubSpot once via OAuth. DataLabs writes your deals, contacts, companies, ticket history, and associated records into a normalized relational database.
- Ask Claude: "Rank each rep by their average closed-won deal size this quarter, show the team median, and flag anyone below the 25th percentile."
- Claude writes a window-function query using RANK and PERCENT_RANK over the synced deal data, runs it against the SQL Server database, and returns the result table.
- Every number in the table traces back to a row in the database. The query is visible, auditable, and copyable.
The sync runs on a schedule - daily on the entry plan, hourly on higher tiers - so the data the AI queries reflects HubSpot state as of the most recent sync, not a stale export from last Tuesday.
The other questions from the comparison table above follow the same pattern. Flagging accounts above the 75th percentile for support ticket volume is a PERCENT_RANK call over the ticket table joined to the company table. Computing each rep's rolling 90-day win rate versus the prior 90-day period is two date-range aggregations joined by rep identifier, expressed as a short CTE chain. Neither requires a separate BI tool license or a manual export.
Who Feels This Gap Most
Teams that run into the window function limit most often share a few characteristics. They have ten or more quota-carrying reps, making rep-to-team comparisons operationally meaningful rather than decorative. They have a RevOps function that owns reporting and is already assembling weekly or quarterly exports from HubSpot by hand. And they are on HubSpot Enterprise because they expected more from the reporting layer - and found the same wall anyway.
For those teams, the aggregate-of-aggregates limitation is not an abstract SQL complaint. It is two hours of spreadsheet work before every QBR, a leaderboard that is stale the moment it is sent, and a recurring inability to answer the question a VP of Sales asks most often: "Where does each rep stand relative to where we normally are at this point in the quarter?"
That question is a window function. It has a one-sentence SQL answer. And with AI Context Bridge, it is now answerable in plain English.
Ready to stop rebuilding the same rep-ranking spreadsheet every QBR cycle?