
Imagine your VP of Sales walks into Thursday's regional review with a single question: which of your three regional teams is actually closing at the highest rate, measured fairly - one vote per rep, not one vote per deal?
You open HubSpot's report builder. You can filter deals by region. You can group by owner. You can count closed-won. But the moment you try to take each rep's close rate and produce a regional average of those rates, the builder has no path forward. There is no second-level aggregation. There is no "average these already-computed percentages."
This is the aggregate-of-aggregates problem. It is not a bug, and it is not solved by upgrading to Enterprise. It is the design boundary of every single-object reporting engine, and it lands squarely in the middle of routine Revenue Operations (RevOps) benchmarking work.
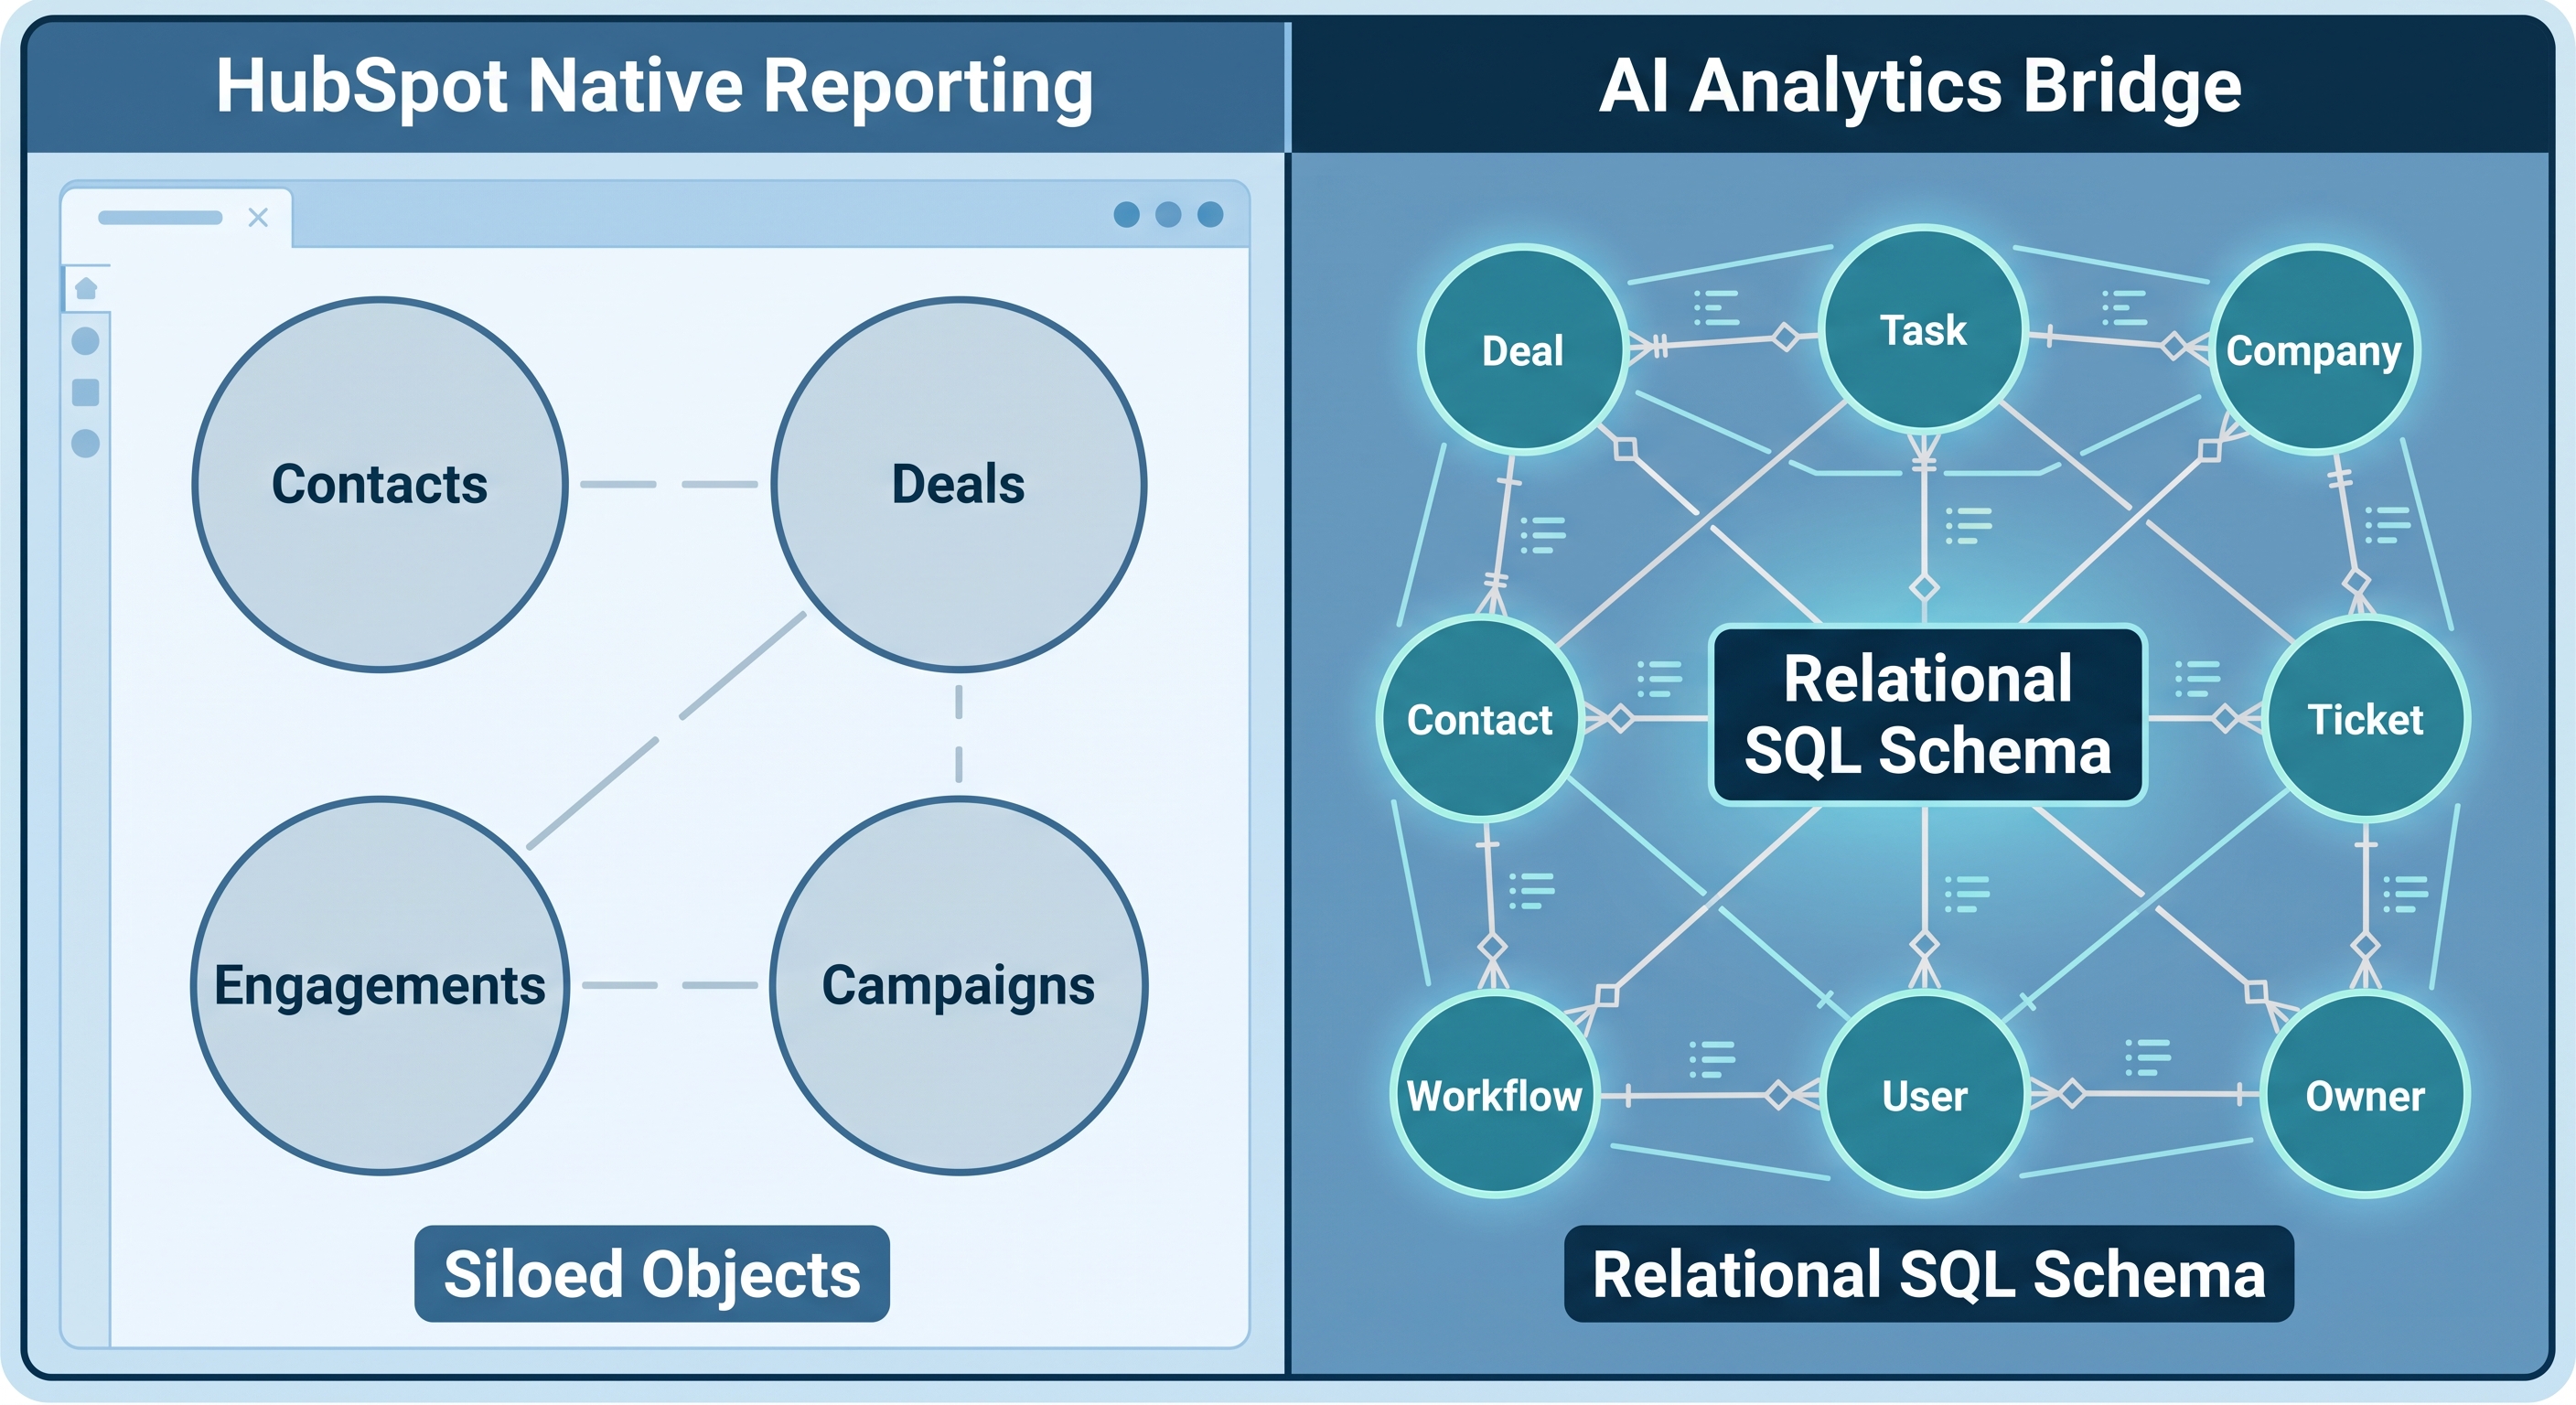
Why One Aggregation Pass Is Not Enough
HubSpot's native reporting works like this: pick an object, apply filters, group by a property, and summarize with COUNT, SUM, or AVG. One pass. One level of grouping.
For day-to-day questions, that is enough. Total deals by stage, pipeline value by close month, average deal size by owner - these are all single-pass computations and HubSpot handles them reliably.
RevOps benchmarking routinely requires a second pass. You want to compute something per entity first (close rate per rep), then summarize those per-entity results across a higher grouping (average close rate per region). That is two passes over the data, and it is precisely what the HubSpot report builder cannot express.
The Math That Exposes the Limit
Here is a concrete example with three reps in the Northeast region, looking back four quarters:
| Rep | Total Deals | Won | Close Rate |
|---|---|---|---|
| Alex | 40 | 15 | 37.5% |
| Jordan | 35 | 20 | 57.1% |
| Sam | 25 | 8 | 32.0% |
| Region total (what HubSpot gives you) | 100 | 43 | 43.0% |
| Average of rep rates (what benchmarking actually needs) | - | - | 42.2% |
The 43.0% figure is the aggregate close rate for the region: 43 won out of 100 total deals. HubSpot can compute this. But it is dominated by deal volume - Alex's 40 deals pull the regional figure toward Alex's personal performance, regardless of whether Alex is representative of the team.
The 42.2% figure is the average of individual close rates: (37.5% + 57.1% + 32.0%) / 3. Each rep counts once. For regional benchmarking and coaching decisions, this is usually the right number. You are comparing regions on how their reps perform, not on which region processed more pipeline volume.
These are not interchangeable numbers. They answer different questions. HubSpot gives you only the first one.
What the SQL Looks Like
A CTE is the natural SQL structure for this problem. The inner query (the CTE body) computes per-rep stats. The outer query summarizes those per-rep results by region. The following illustrates the pattern with representative column names:
WITH rep_close_rates AS (
    SELECT
        owner_id,
        owner_name,
        region,
        COUNT(*)                                                     AS total_deals,
        SUM(CASE WHEN deal_stage = 'closedwon' THEN 1 ELSE 0 END)   AS won_deals,
        CAST(
            SUM(CASE WHEN deal_stage = 'closedwon' THEN 1 ELSE 0 END)
            AS FLOAT
        ) / NULLIF(COUNT(*), 0)                                      AS close_rate
    FROM deals
    WHERE close_date >= DATEADD(quarter, -4, GETDATE())
    GROUP BY owner_id, owner_name, region
)
SELECT
    region,
    COUNT(owner_id)                    AS rep_count,
    ROUND(AVG(close_rate) * 100, 1)    AS avg_close_rate_pct,
    ROUND(MIN(close_rate) * 100, 1)    AS lowest_rep_pct,
    ROUND(MAX(close_rate) * 100, 1)    AS highest_rep_pct,
    ROUND(STDEV(close_rate) * 100, 1)  AS close_rate_spread
FROM rep_close_rates
GROUP BY region
ORDER BY avg_close_rate_pct DESC;
The AVG(close_rate) in the outer query is the aggregate of aggregates. It computes the mean of the per-rep close rates that were each computed inside the CTE. This is the second-level summarization HubSpot cannot perform.
The STDEV(close_rate) column adds something HubSpot also cannot produce: within-region spread. A region with a 48% average close rate and a 3% standard deviation is a different coaching situation than one with a 48% average and an 18% standard deviation. Both regions look identical in any HubSpot native report that is constrained to a single aggregation pass.
Where This Pattern Appears in Real RevOps Work
The regional close rate example is one instance of a pattern that recurs throughout revenue benchmarking. Any question of the form "compute a ratio per rep, then compare those ratios across teams or segments" hits the same structural wall:
| Benchmarking Question | Per-Entity Metric (First Pass) | Aggregate Metric (Second Pass) |
|---|---|---|
| Regional close rate benchmark | Close rate per rep | Average of rep close rates, grouped by region |
| Segment conversion by team | Qualified-to-closed rate per Sales Development Representative (SDR) | Average of SDR rates by Ideal Customer Profile (ICP) segment |
| Cycle time by hire cohort | Average days to close per rep | Average of rep-level cycle times, grouped by hire-year cohort |
| Email effectiveness by territory | Reply rate per sender | Average of sender reply rates, grouped by territory |
The CTE structure is the same for each of these. The inner query computes the per-entity rate. The outer query aggregates those rates by the grouping dimension. HubSpot cannot express any of them natively.
How AI Context Bridge for HubSpot Handles This
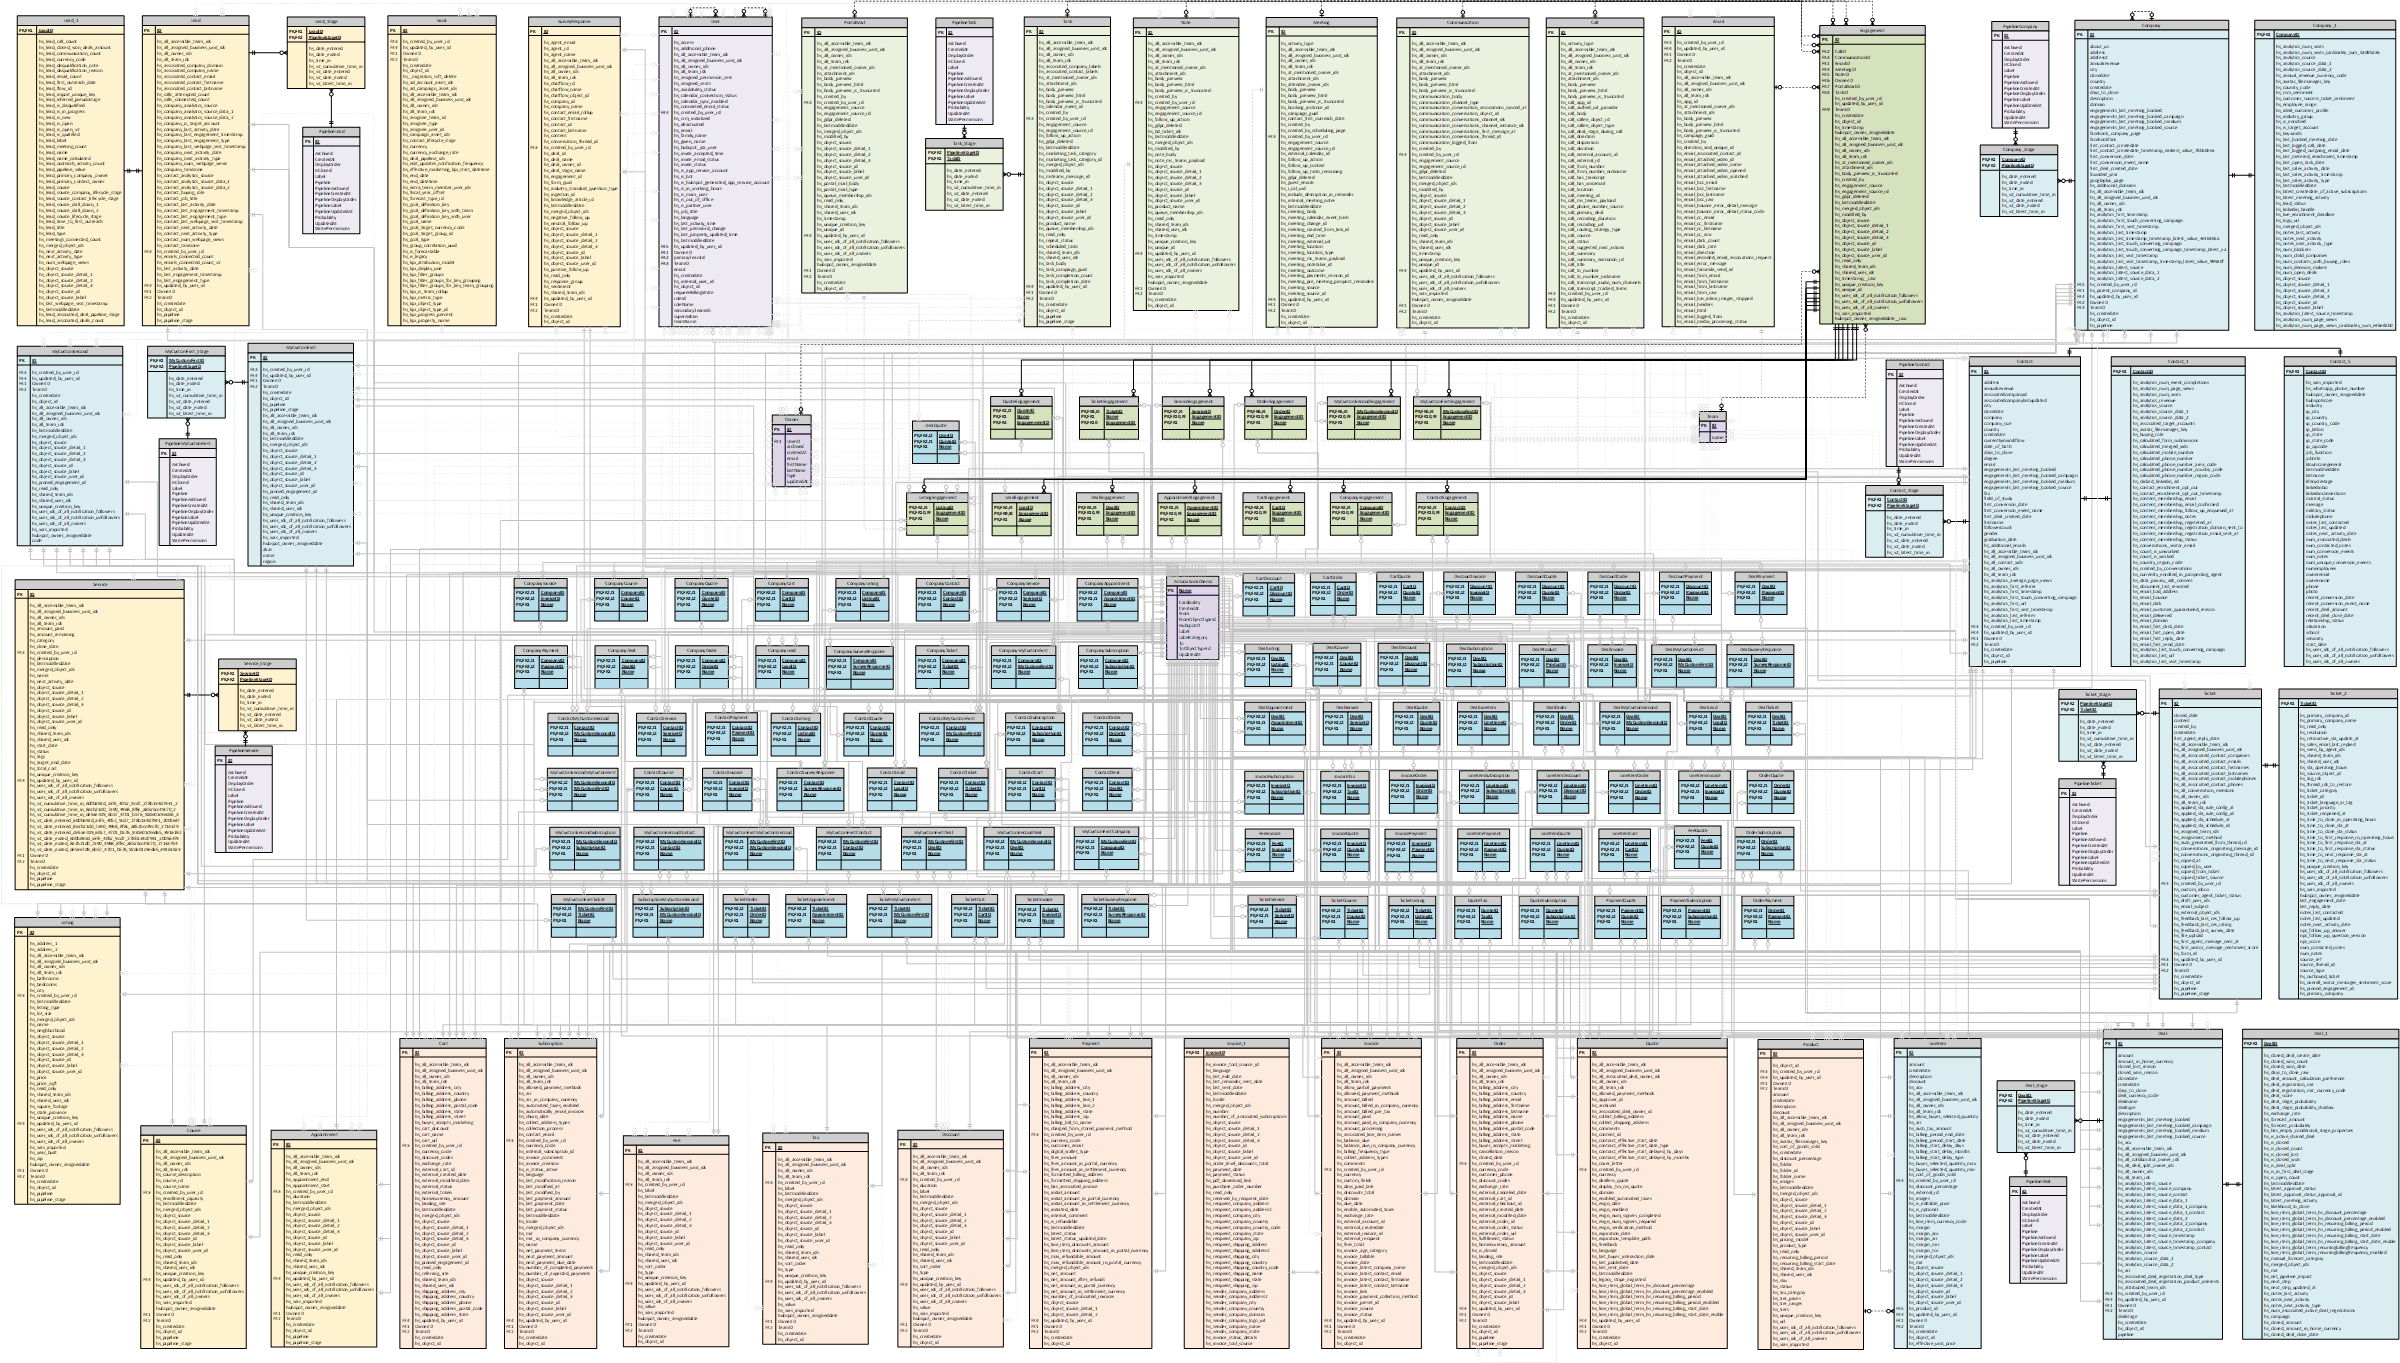
DataLabs.store's AI Context Bridge for HubSpot connects to your HubSpot account through OAuth, syncs your deals, contacts, companies, and associated objects into a fully normalized Microsoft SQL Server database, and exposes that database through a Model Context Protocol (MCP) endpoint connected to Claude or ChatGPT. You type a plain-English question. The AI writes the SQL, executes it against your synced data, and returns the result alongside the query itself so you can inspect, copy, or extend it.
For the regional close rate question, you would type something like: "Show me the average close rate per region, calculated as the mean of each rep's individual close rate over the last four quarters - not the combined regional total." The AI writes a CTE-based query, runs it against your synced HubSpot data, and returns the ranked regional table. You can ask a follow-up to filter by deal size, change the time window, or require a minimum deal count per rep to exclude outlier sample sizes. Each follow-up generates a revised query against the same live database.
The query is visible every time. You can verify it reflects exactly what you asked, hand it to a business intelligence (BI) tool to schedule as a recurring report, or pass it to an analyst to extend. This is not a black-box dashboard returning a single number - it is auditable SQL against your actual HubSpot data, running on a fully relational database that holds the join-capable schema.
If the regional benchmarking table is a fixture in your quarterly reviews - or if you are building any report that computes a ratio per rep and rolls it up by region or segment - a SQL layer over your HubSpot data is the durable answer. AI Context Bridge connects through HubSpot's OAuth flow and keeps your data current on the sync schedule your plan includes.