
Your CSM notices that Acme Corp hasn't responded to two check-in emails. They log a manual task in HubSpot, flag the account for review, and put it on the next weekly team agenda. By the time that meeting happens, Acme has opened two support tickets and their renewal is 40 days away.
That sequence is not a process failure. It is a visibility failure. The signals were all in HubSpot, spread across three different object types, with no native way to combine them into a single early-warning view.
Building a real account health score - the kind that could have surfaced Acme three weeks earlier - requires joining contact-level activity, company-level ticket counts, and deal renewal proximity into one composite number per account. HubSpot's reporting engine cannot do that. Every object lives in its own report, and closing that gap is not a matter of upgrading to a higher plan tier. It is a structural constraint of how HubSpot's reporting layer is built.
What a Useful Churn Signal Actually Needs
Customer success (CS) teams that build account health scoring systematically, typically with a data warehouse or custom analytics tooling, converge on three signal categories.
Activity recency. When was the last time any contact at this company was engaged, whether by email, phone call, or meeting? HubSpot tracks this at the contact level via a last_activity_date property. But to find the most recent touch for the entire account, you need to aggregate across all contacts associated with that company. That requires a join and a GROUP BY, two things HubSpot's report builder cannot do within a single report.
Open ticket count and age. How many support tickets are currently open for this account, and how long have they been sitting? One informational ticket open for two years is background noise. Three tickets opened in the last 30 days, all waiting on your team, is a pattern. Getting that count requires joining the ticket object to the company object, filtering by status, and grouping by account.
Renewal proximity. Is there a renewal deal in the pipeline for this account, and how close is it? An account that has gone quiet and is accumulating tickets, with a renewal 18 months away, is a different priority than the same profile with 40 days until close. That proximity requires querying the deals object, filtering for renewal-stage deals, and linking back to the account.
None of these alone is decisive. A company might go quiet for two weeks because their champion is on vacation. But a company that has been quiet for six weeks, has three open tickets, and has a renewal in 40 days is a specific risk that should surface automatically, not depend on someone remembering to check.
The Structural Problem With HubSpot Reporting
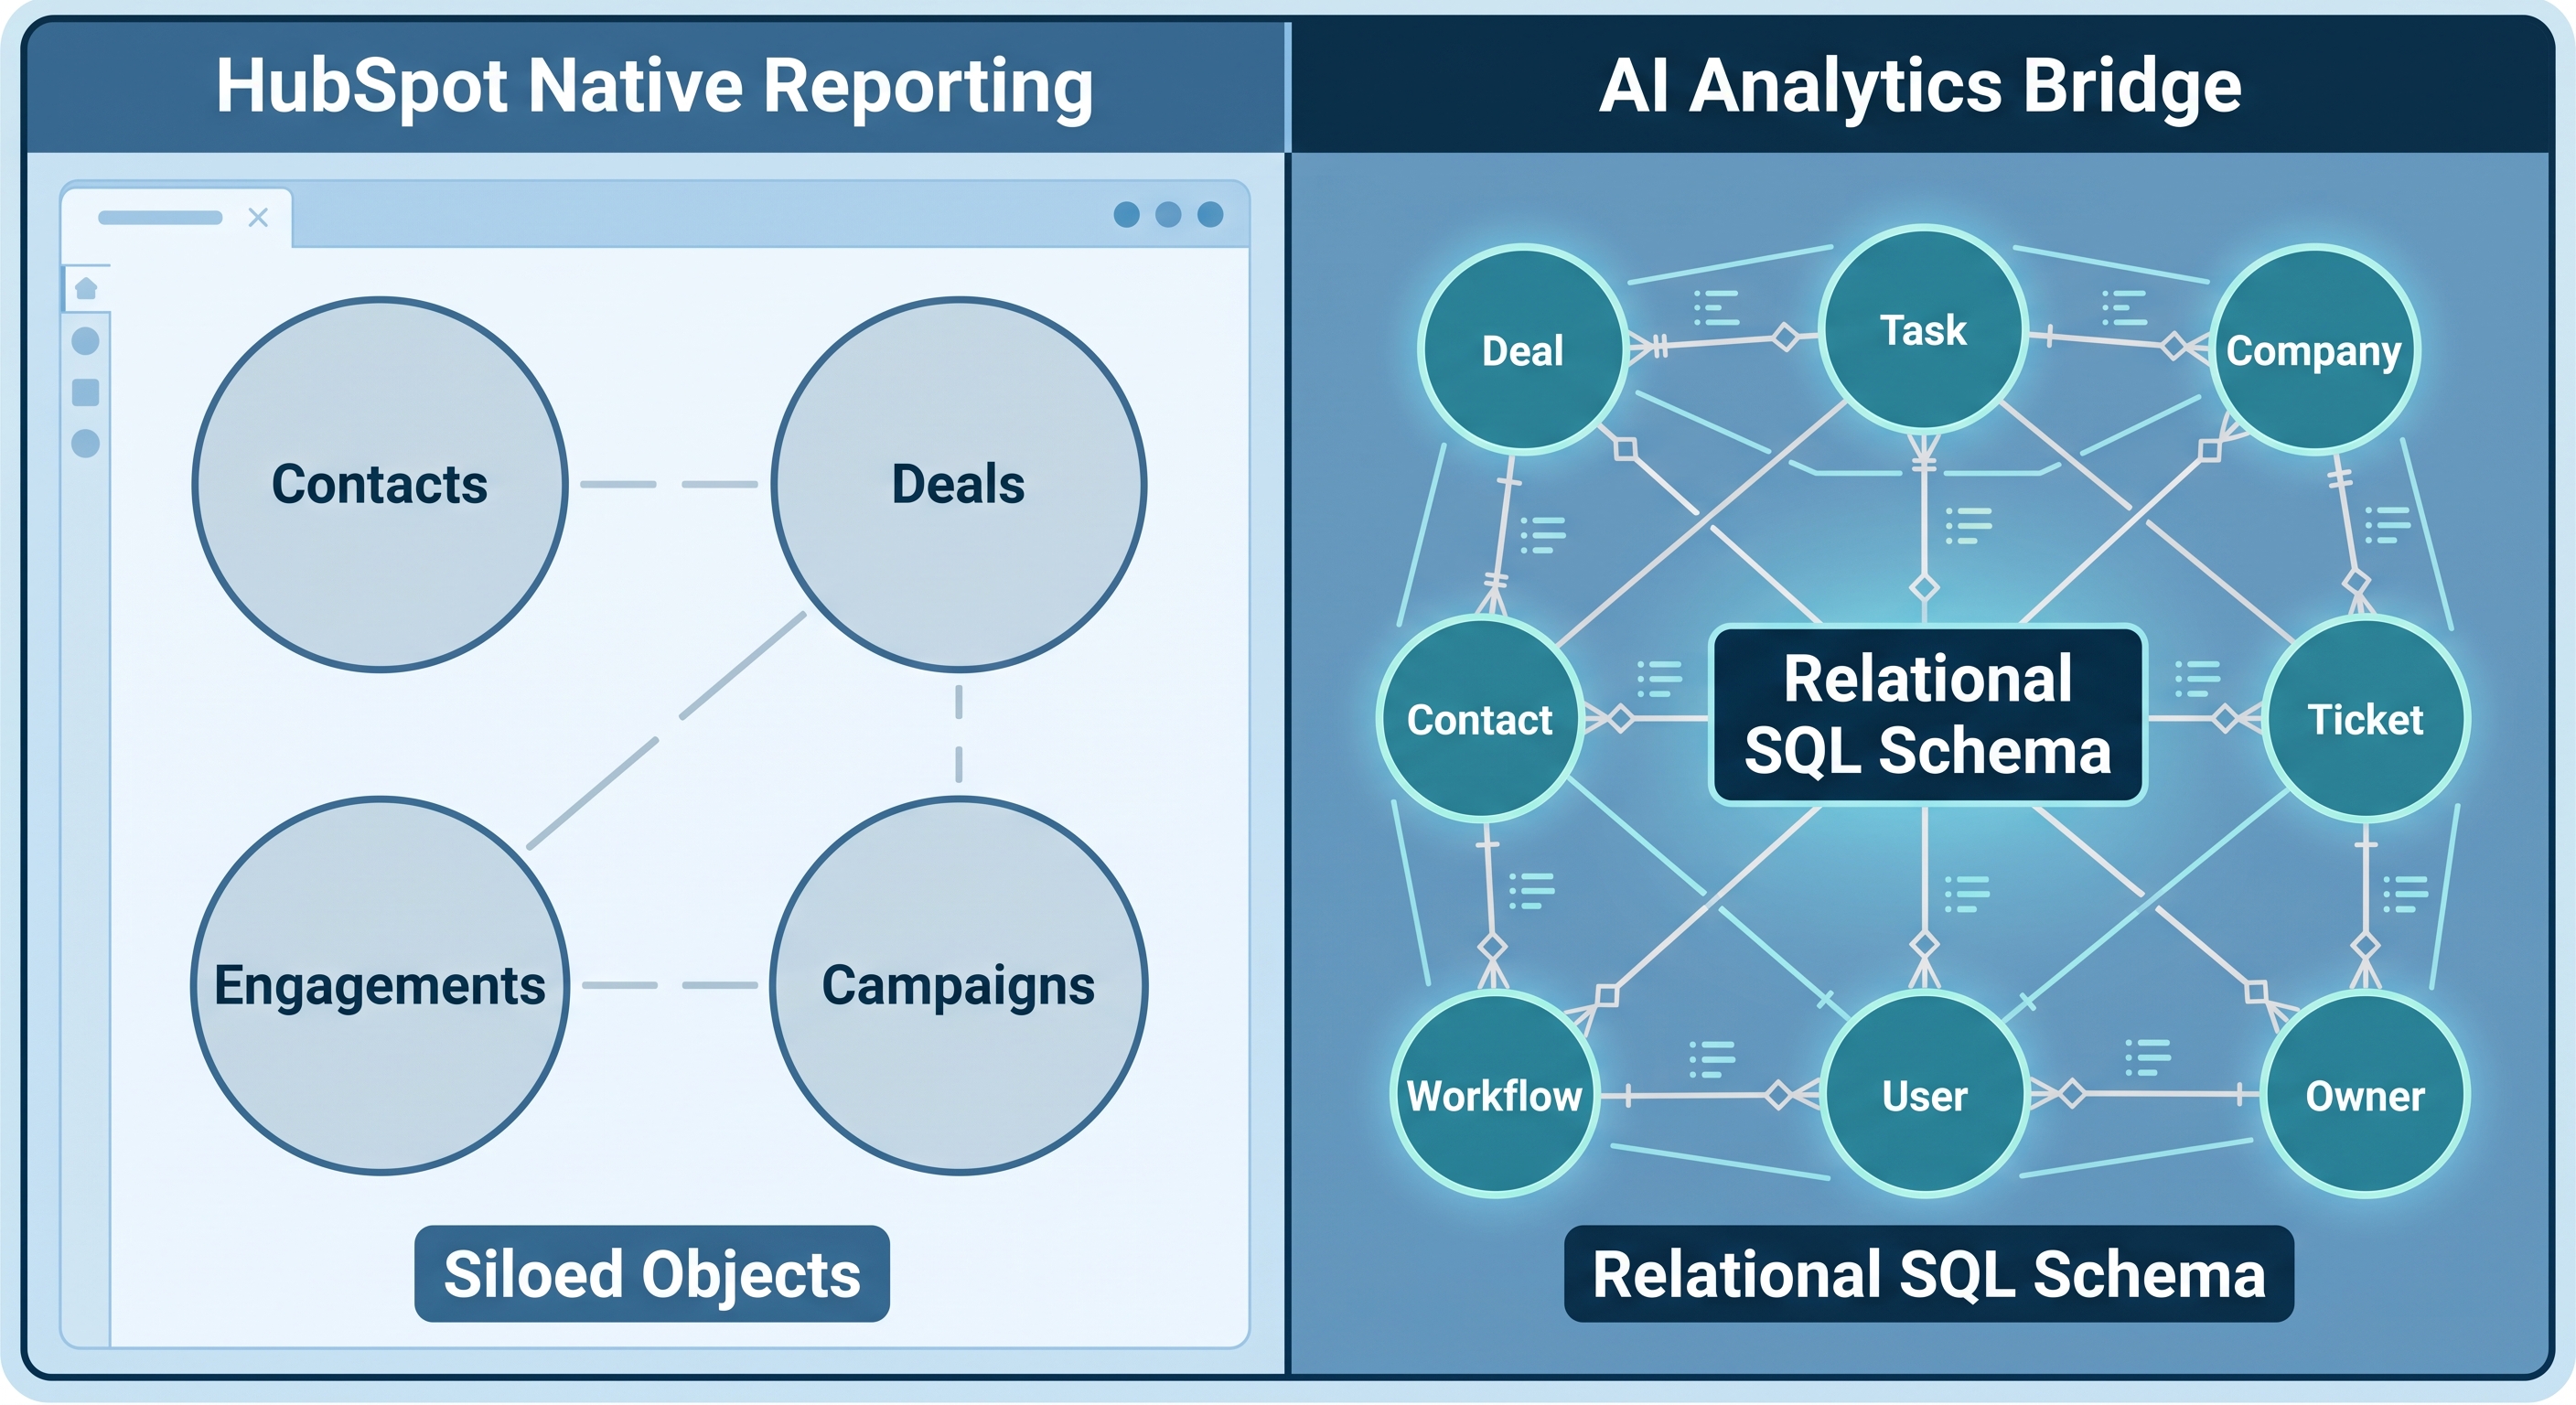
HubSpot's native reports operate on one object type at a time. The custom report builder, available on Professional and Enterprise plans, extends this slightly by allowing access to an associated object's properties via dot notation - pulling a contact's company name into a contact report, for example. But the limits are hard:
- You cannot aggregate across all contacts associated with a company within a single report.
- You cannot combine a ticket count, an activity recency calculation, and a deal date into one row per company.
- There is no common table expression (CTE), no window function, and no aggregate of aggregates.
A revenue operations (RevOps) team that wants this kind of view weekly needs to export three separate reports, stitch them together in a spreadsheet, and repeat that process every week. That is the workaround, and it misses signals whenever an export is a few days old or someone skips a step.
How the SQL Layer Changes This
AI Context Bridge for HubSpot from DataLabs.store syncs your HubSpot data into a real Microsoft SQL Server database via OAuth. Companies, contacts, tickets, and deals all land in separate, properly related tables with foreign key associations intact. This is not a flat export. It is a normalized relational schema that supports the full range of T-SQL operations: joins, CTEs, window functions, and aggregates built on top of other aggregates.
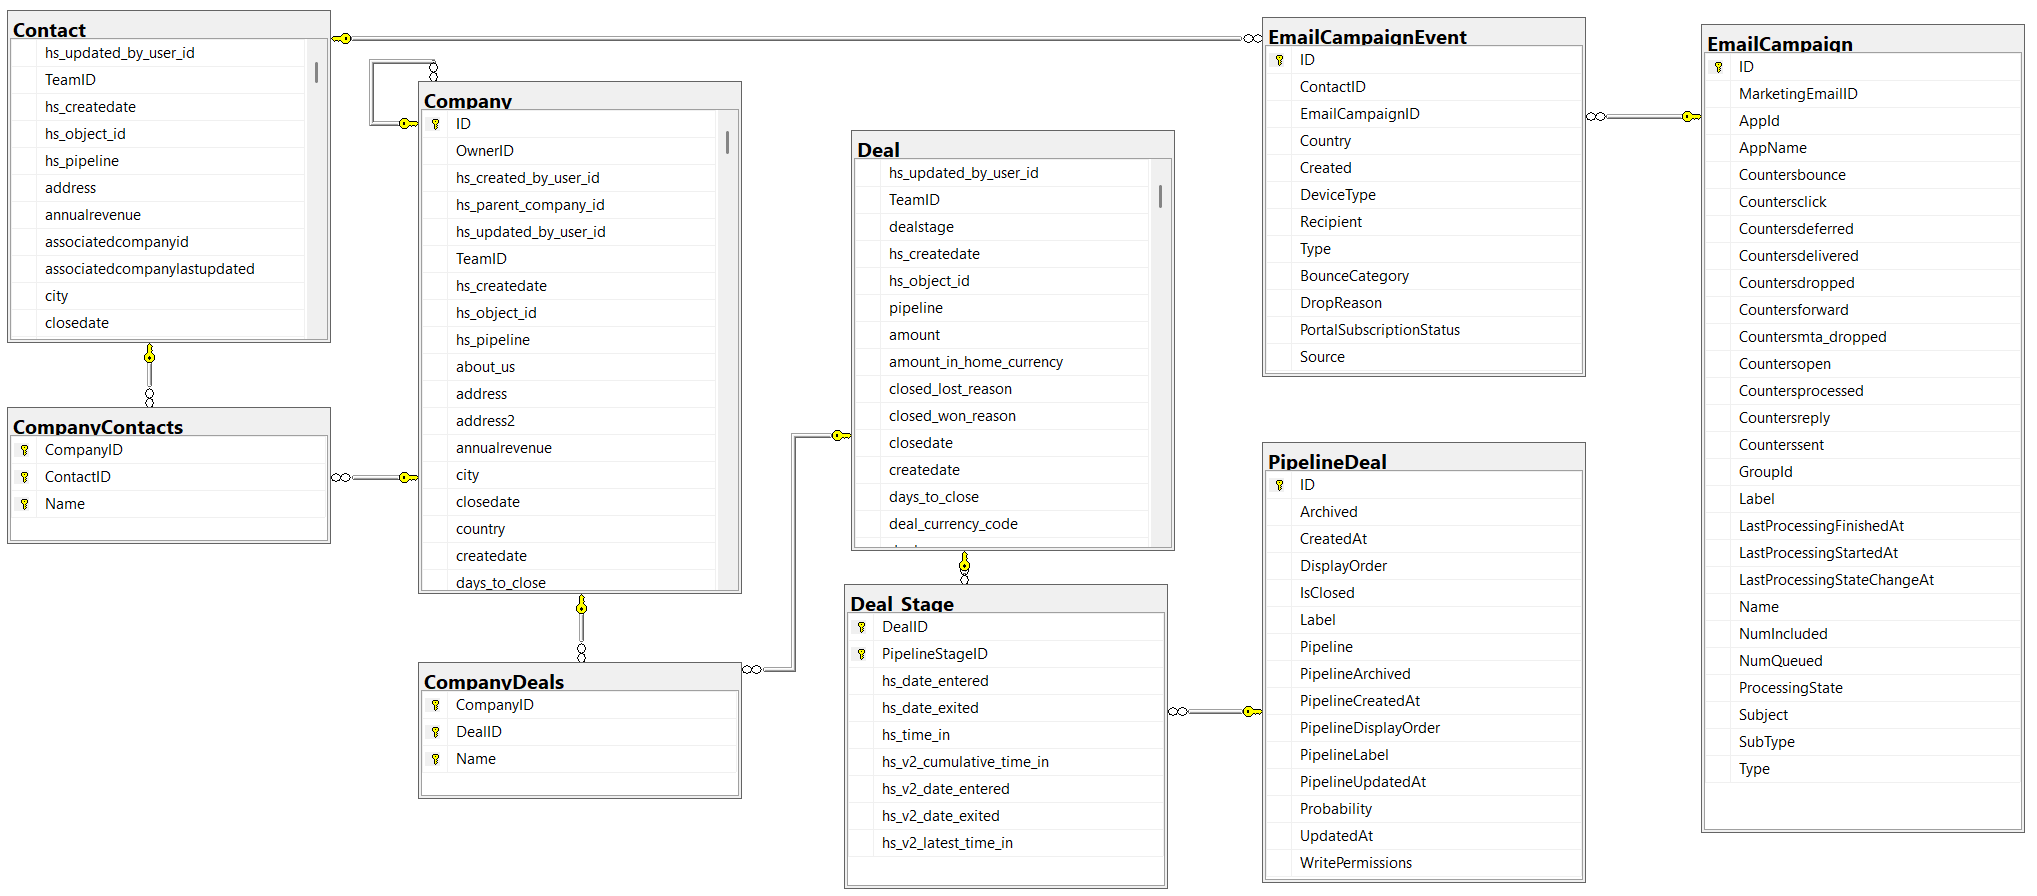
Once the data is in SQL Server and connected through the Model Context Protocol (MCP) endpoint, a CS manager or RevOps analyst can ask "which accounts have the most churn signals right now?" in plain English. AI Context Bridge generates the SQL on the fly, runs it against the synced data, and returns the answer with the underlying query visible for audit.
The query below illustrates the structure of what AI Context Bridge would produce for this question. AI Context Bridge generates the actual T-SQL against your synced schema's real table and column names; what follows shows the pattern and logic.
-- Account health score: activity, ticket, and renewal signals per account
WITH activity_recency AS (
    SELECT
        ct.associated_company_id                               AS company_id,
        DATEDIFF(day, MAX(ct.last_activity_date), GETDATE())   AS days_since_last_contact
    FROM Contact ct
    WHERE ct.last_activity_date IS NOT NULL
    GROUP BY ct.associated_company_id
),
open_tickets AS (
    SELECT
        t.associated_company_id                                AS company_id,
        COUNT(*)                                               AS open_ticket_count
    FROM Ticket t
    WHERE t.status <> 'Closed'
    GROUP BY t.associated_company_id
),
upcoming_renewals AS (
    SELECT
        d.associated_company_id                                AS company_id,
        MIN(DATEDIFF(day, GETDATE(), d.close_date))            AS days_to_renewal
    FROM Deal d
    WHERE d.pipeline_stage LIKE '%renewal%'
      AND d.close_date > GETDATE()
    GROUP BY d.associated_company_id
),
scored AS (
    SELECT
        co.company_id,
        co.name                                                AS account_name,
        COALESCE(ar.days_since_last_contact, 999)              AS days_since_activity,
        COALESCE(ot.open_ticket_count, 0)                      AS open_tickets,
        COALESCE(ur.days_to_renewal, 9999)                     AS days_to_renewal,
        -- Activity signal: 0 to 35 points
        CASE
            WHEN COALESCE(ar.days_since_last_contact, 999) > 60 THEN 35
            WHEN COALESCE(ar.days_since_last_contact, 999) > 30 THEN 20
            ELSE 0
        END
        -- Ticket signal: 0 to 35 points
        + CASE
            WHEN COALESCE(ot.open_ticket_count, 0) >= 3        THEN 35
            WHEN COALESCE(ot.open_ticket_count, 0)  = 2        THEN 20
            WHEN COALESCE(ot.open_ticket_count, 0)  = 1        THEN 10
            ELSE 0
        END
        -- Renewal proximity signal: 0 to 30 points
        + CASE
            WHEN COALESCE(ur.days_to_renewal, 9999) <= 45      THEN 30
            WHEN COALESCE(ur.days_to_renewal, 9999) <= 90      THEN 15
            ELSE 0
        END                                                    AS risk_score
    FROM Company co
    LEFT JOIN activity_recency  ar ON ar.company_id = co.company_id
    LEFT JOIN open_tickets      ot ON ot.company_id = co.company_id
    LEFT JOIN upcoming_renewals ur ON ur.company_id = co.company_id
)
SELECT
    account_name,
    days_since_activity,
    open_tickets,
    days_to_renewal,
    risk_score
FROM scored
WHERE risk_score > 0
ORDER BY risk_score DESC;
Four CTEs, three object types, two independent aggregations, and one composite score in a single query. None of this is expressible in HubSpot's native report builder at any plan tier.
What This Looks Like When You Ask the Question
When a CS manager asks "which of our accounts have the highest churn risk right now?" through AI Context Bridge, there is no pre-built dashboard to navigate and no export to download. The AI generates the query on the fly, runs it against your current synced data, and returns a ranked table. Each row shows the account name, the three component signals, and the composite risk score. The underlying SQL is visible and auditable by anyone on the team.
The output surfaces accounts that would never appear in any single-object HubSpot report: the ones that are quiet, accumulating tickets, and approaching a renewal simultaneously. Those are precisely the accounts that turn up in retrospective churn reviews as "we never saw it coming." With the right query, they are findable weeks in advance.
Keeping the Score Current
A health score that runs on stale data loses its purpose quickly. If the last HubSpot sync happened two weeks ago, the "days since last activity" figure is already wrong. AI Context Bridge syncs on daily or hourly schedules depending on the plan tier, so the ranked account list reflects your actual current state rather than a snapshot from a manual export that may be weeks old.
For CS teams running weekly account reviews, daily sync is sufficient. For teams doing real-time triage on high-value renewals, the hourly tier keeps the list accurate throughout the day.
Getting Started
Connecting your HubSpot account takes a few minutes via OAuth. Once your data is synced to SQL Server and the MCP endpoint is live, the account health score query is one of the first things your CS team can ask, alongside renewal forecasting, pipeline stagnation analysis, and contact coverage reporting by account tier.