
Every quarter, the same question surfaces in the revenue forecast meeting: is this Commit number real?
HubSpot shows $2.1M sitting in the Commit stage. Three of your eight reps account for most of it. The system assigns the same stage probability to all three. One of those reps has closed nearly every deal they have ever committed. Another routinely moves deals into Commit early and closes them at 30%.
The $2.1M is a number. It is not a forecast.
How HubSpot Assigns Forecast Probability
HubSpot's forecast tool works at the stage level. An administrator configures each stage's close probability - Commit at 85%, Best Case at 50%, and so on - and every deal in that stage, regardless of who owns it, contributes to the forecast at that rate.
This is a reasonable starting point when a team is new and lacks the closed-deal history to measure rep-level performance. It becomes a source of systematic error once a team has 12 months or more of closed-deal data, because by that point the history almost always shows significant variance between individual reps. A rep who closes 78% of their committed deals and a rep who closes 29% of theirs are not equivalent forecast risks. Treating them as such inflates or deflates the total forecast in proportion to whose pipeline happens to dominate the Commit stage that quarter.
HubSpot does allow managers to submit override forecasts manually. But that is a judgment layer on top of the same underlying number. There is no mechanism to derive per-rep close rates from historical data and feed them back into the pipeline weighting automatically. The data exists in HubSpot - the reporting layer simply cannot connect it to the current forecast calculation.
Why the Spread Between Reps Compounds Across a Team
The arithmetic is straightforward. Take two reps, each carrying $600,000 in the Commit stage this quarter.
- Rep A has closed 74% of their committed deals over the past 12 months.
- Rep B has closed 31% of their committed deals over the same period.
At an 85% stage probability, HubSpot forecasts $510,000 from each rep, totaling $1.02M combined.
Weighted by their actual track records: $444,000 from Rep A and $186,000 from Rep B, totaling $630,000.
That $390,000 gap - about 38% of the stage-probability forecast - comes entirely from applying a uniform rate that does not reflect what either rep has demonstrated. This is a two-rep illustration. In a team of eight or ten, with larger pipeline amounts and wider spread in individual close rates, the cumulative distortion is routinely what explains why a company can miss forecast consistently despite accurate stage progression in HubSpot.
What Getting to the Real Number Actually Requires
A rep-calibrated forecast needs two distinct aggregation steps.
Step one: For each rep, compute their historical close rate from deals that reached a closed outcome during a defined lookback window - typically the trailing 12 months. This produces one row per rep: won deals, total closed deals, win rate.
Step two: For each open deal in the current pipeline, multiply the deal amount by the owning rep's rate from step one, then sum by rep or by team.
The join between these two steps is what makes this impossible in HubSpot's native reporting. The rate derived in step one is an intermediate aggregation over historical data. The pipeline weighting in step two is a calculation against current-state data. Expressing both in a single result requires a subquery or a Common Table Expression (CTE): a block of SQL that computes the per-rep rates first, names that result, and makes it available to the outer query that does the pipeline multiplication.
HubSpot's custom report builder has no mechanism to express this pattern. A report can show each rep's historical close rate. A separate report can show each rep's open pipeline. There is no path within the native tool to derive a rate in one aggregation and apply it as a multiplier in another - in the same calculation.
What This Looks Like in AI Context Bridge
AI Context Bridge for HubSpot syncs your HubSpot data into a normalized SQL Server database - separate linked tables for deals, contacts, deal owners, pipeline stages, and the associations between them - and exposes that database to Claude or ChatGPT through a Model Context Protocol (MCP) endpoint. You ask in plain English; the AI writes and runs the SQL, and returns both the query and the result.
A question like "For each rep, show me their close rate on deals closed in the last 12 months, then apply that rate to weight their open pipeline and rank by calibrated expected value" maps directly to the two-step CTE query described above. The AI constructs the SQL, executes it, and returns a table showing each rep's name, their historical close rate, their raw open pipeline amount, and their calibrated forecast value. You can see immediately which rep's $600,000 in Commit is worth $456,000 and which one is worth $186,000.
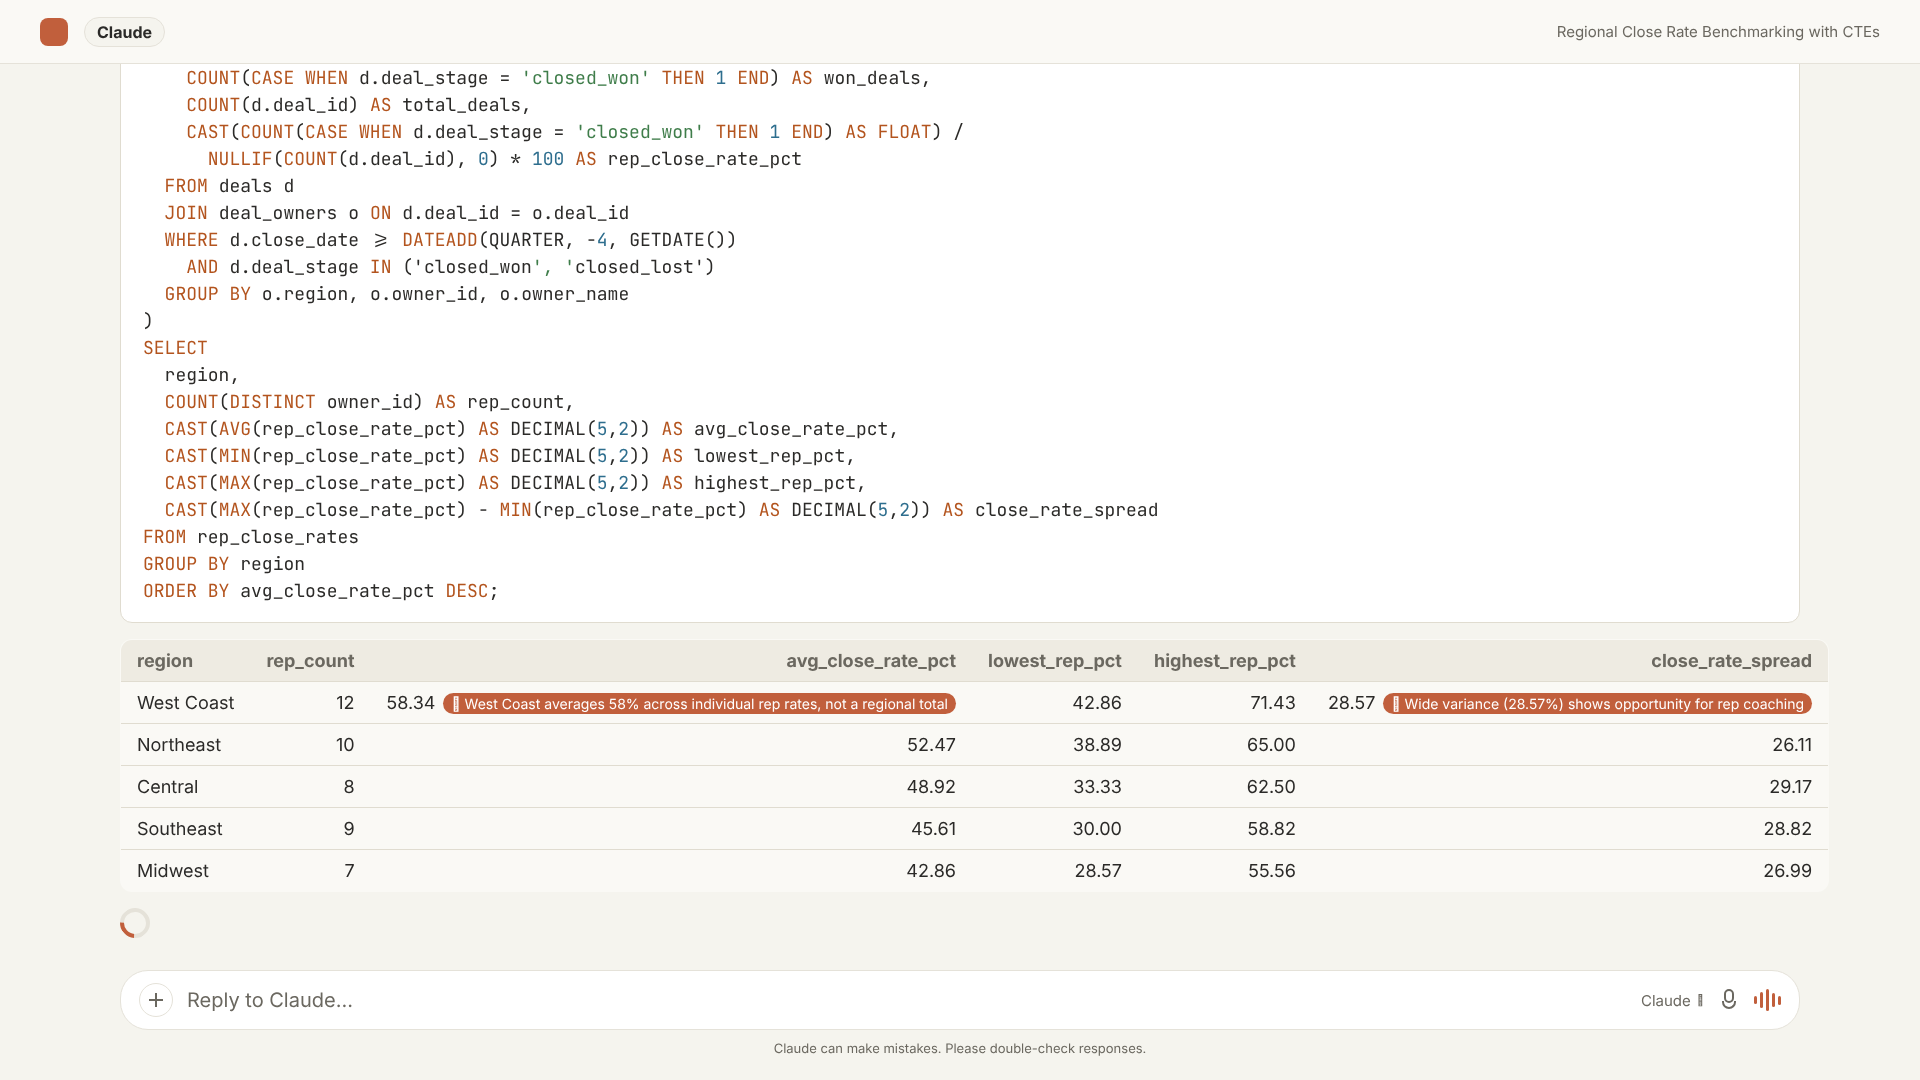
A live AI Context Bridge session deriving close rates via a two-pass CTE - the same structural pattern required for per-rep forecast calibration.
That query, in a conversational interface, takes seconds to answer a question that previously required either a manual spreadsheet reconciliation or an analyst with direct SQL access. The query is auditable: you see exactly what data it read, what filters it applied, and what arithmetic produced each number.
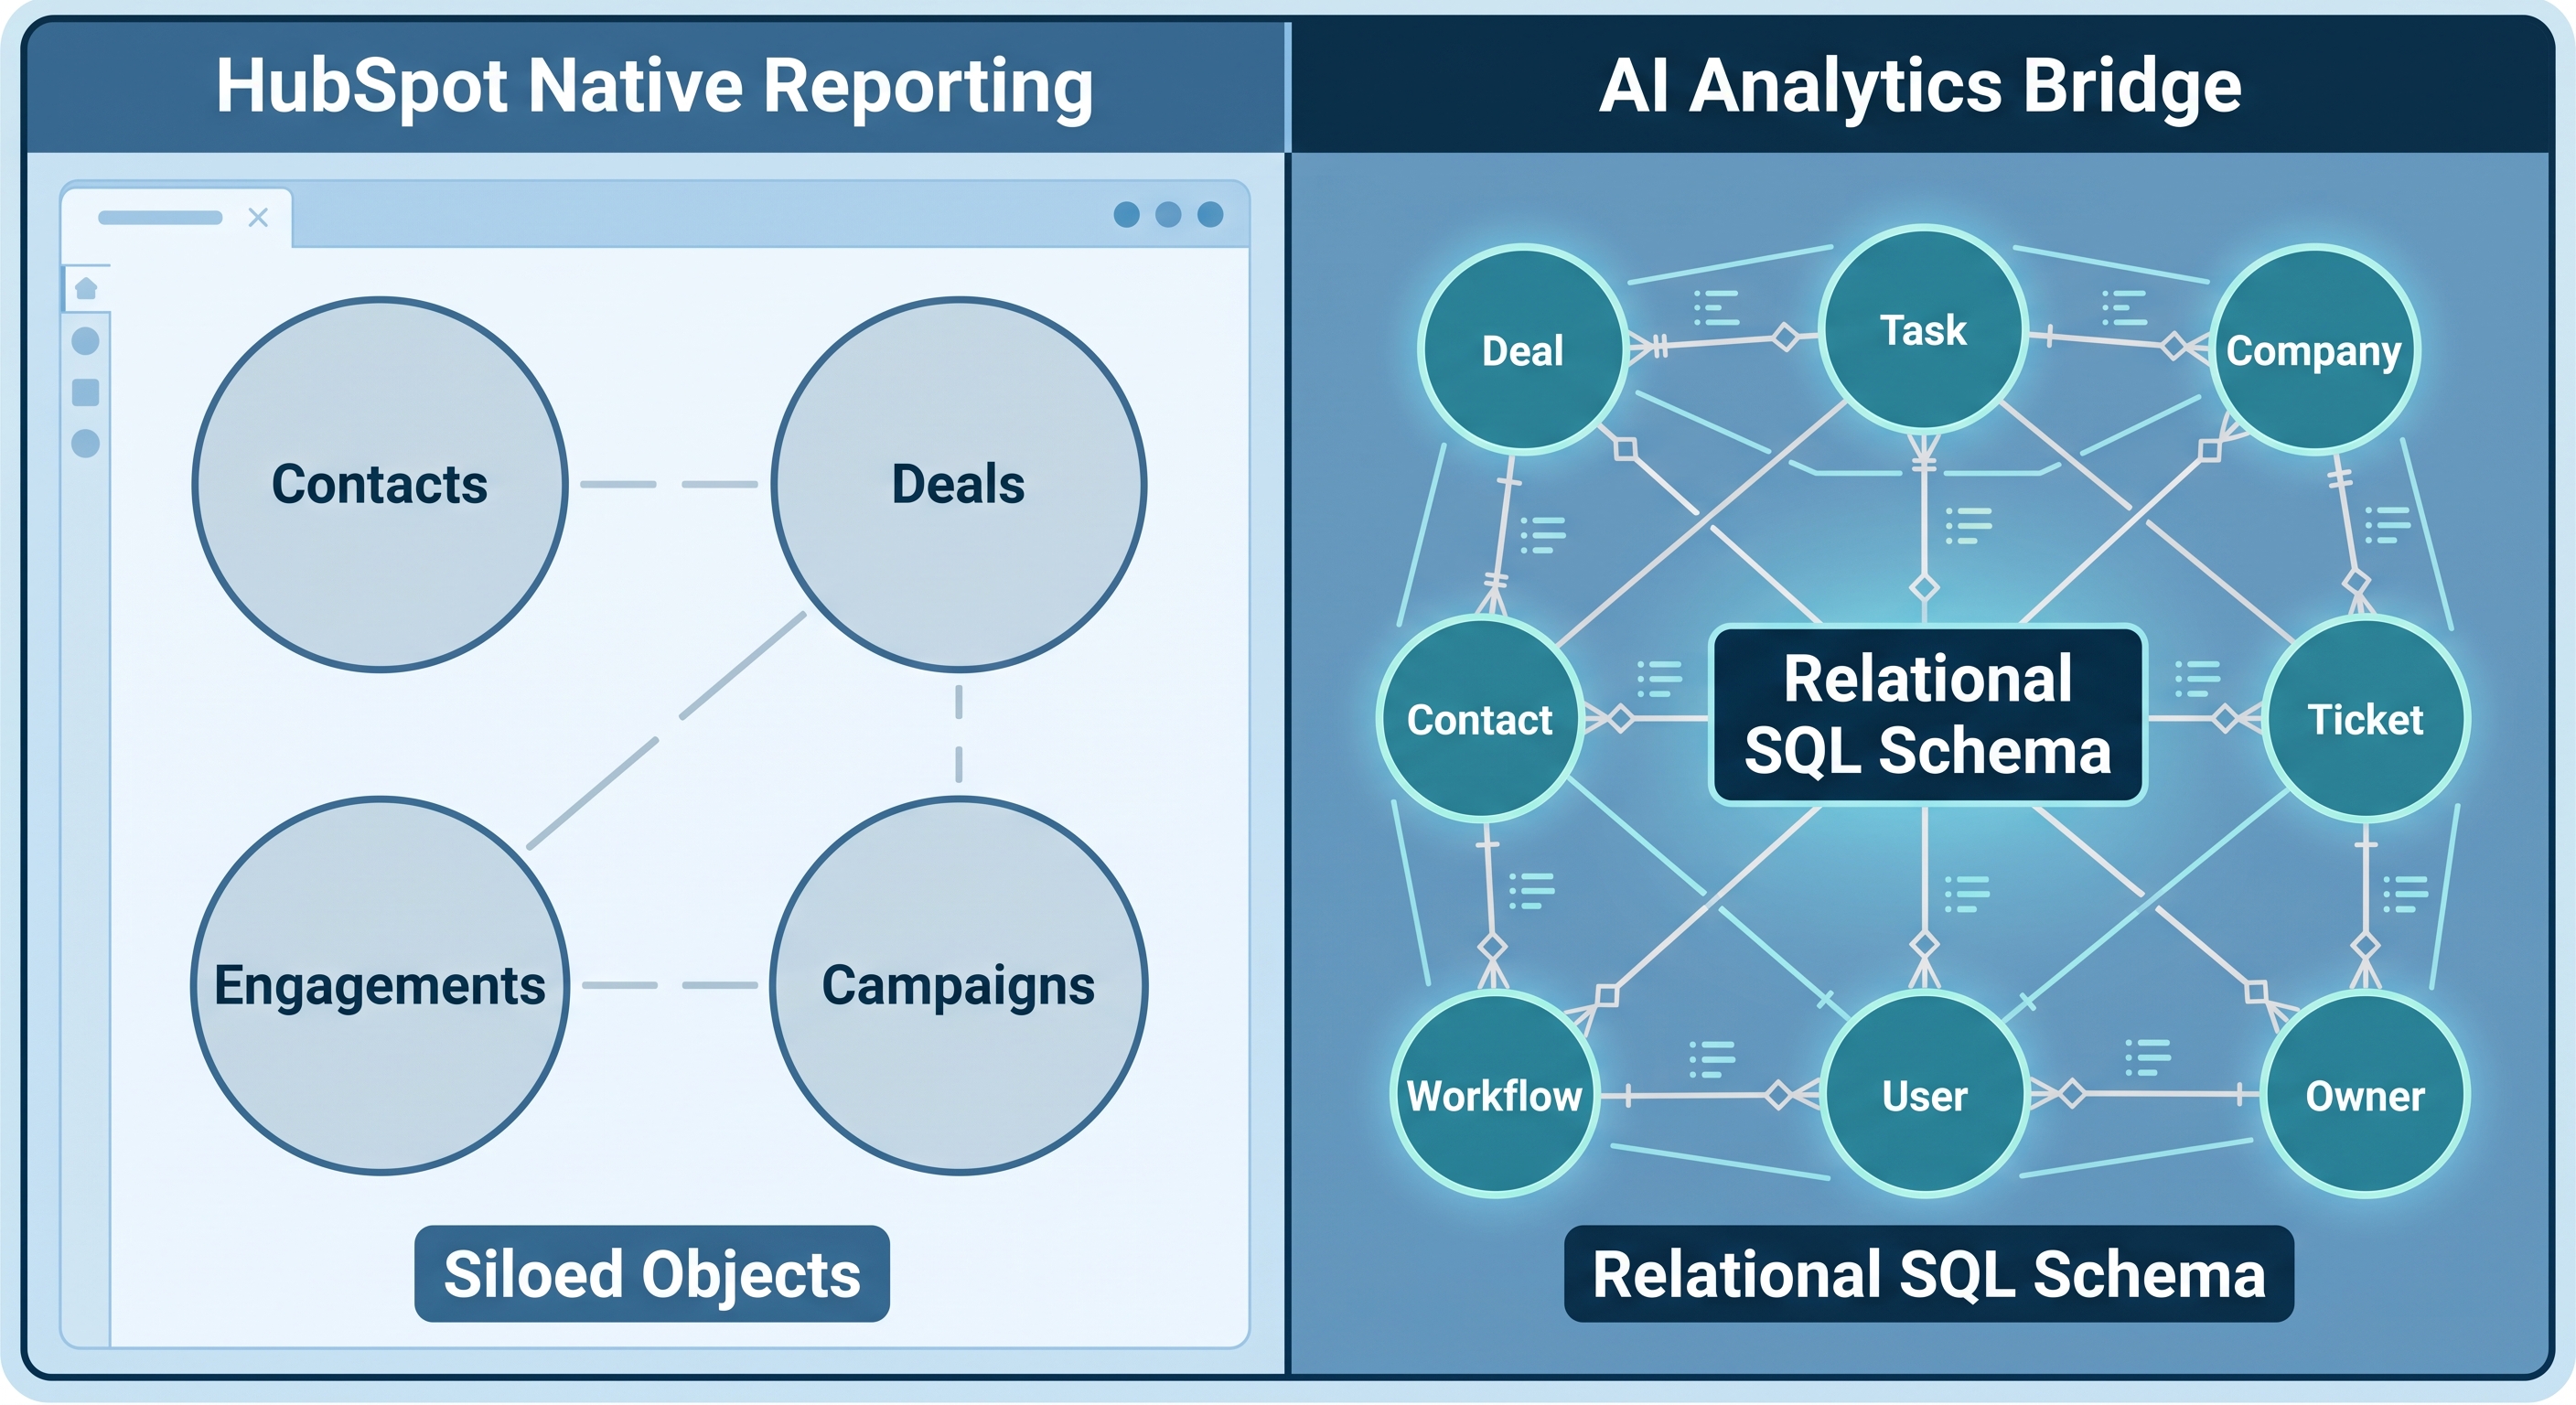
HubSpot's reporting model operates on one object at a time. AI Context Bridge exposes a relational database where deals, owners, stages, and historical outcomes can be joined freely across time ranges.
A Forecast Number You Can Explain
The forecast that goes on the board slide should be traceable. When someone asks "why are you projecting $1.4M this quarter?", the answer should not be "HubSpot's Commit stage is 85% of $1.65M." It should be "here is the SQL that weighted each rep's open deals by their 12-month close rate, and here is the output table."
DataLabs.store exists for exactly this category of question: analytically specific, structurally impossible in HubSpot's native tool, and expressible in a single plain-English sentence that translates directly to verifiable SQL.
If you have a year or more of closed-deal history in HubSpot and you are still forecasting by stage probability alone, you have a concrete measurement sitting unused. The data that would let you trust some commits more than others already lives in your CRM. The gap is the query layer.