
HubSpot revenue data lives in three separate rooms. Sales tracks deal stages and pipeline value. Marketing tracks email campaigns, open rates, and form fills. Customer success tracks renewal tickets, health scores, and escalations. All three teams report out of HubSpot, and all three see an accurate picture of their own corner. But no one has a query that combines all three into a single row.
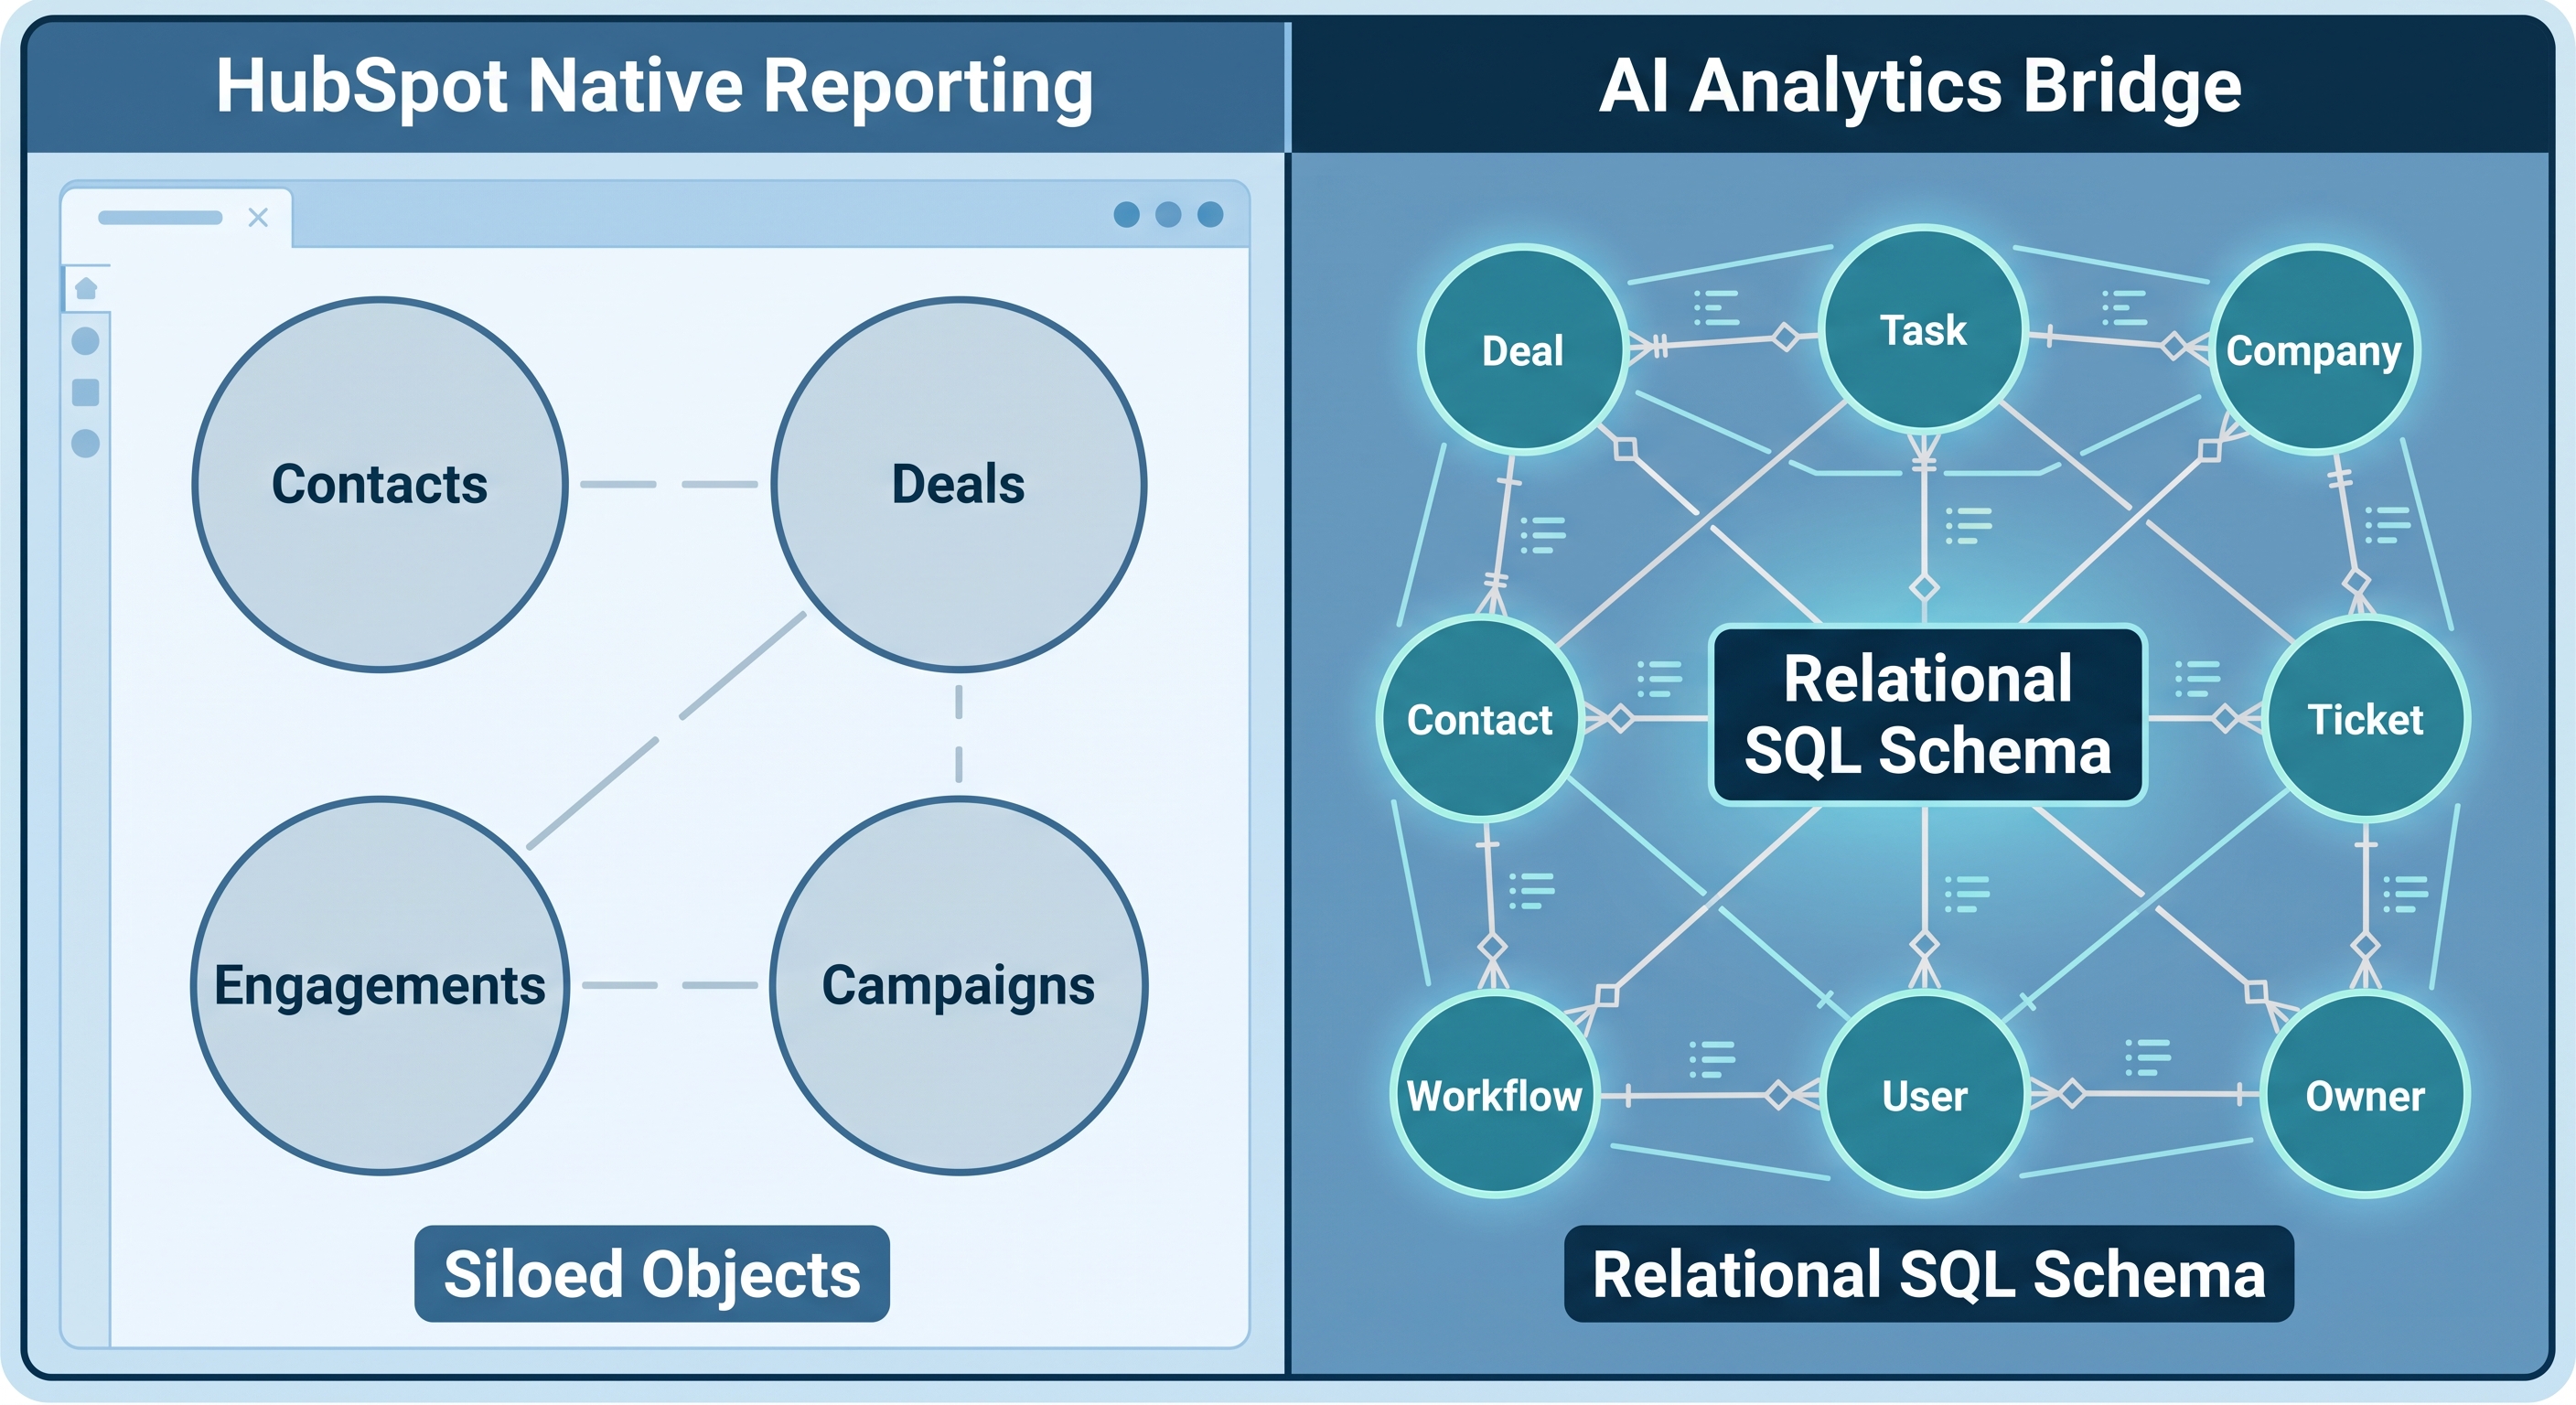
That is not a workflow problem. It is a data model problem. HubSpot's native reporting layer is anchored to individual objects: a report about deals is a deals report, a report about contacts is a contacts report, and while you can associate a second object type in the builder, you cannot join contacts to deals to tickets to email events in a single result set. The structural ceiling is the same regardless of HubSpot tier.
For RevOps teams building a unified revenue view - one that surfaces pipeline risk from CS signals, engagement decay from marketing data, or aggregate exposure by account health tier - a real relational database and real SQL are the only path from three separate data streams to one answerable question.
This post walks through exactly how that join structure works: why HubSpot's native reporting falls short, how the data lands in SQL, and three concrete queries that produce the cross-functional revenue view RevOps teams actually need.
Why HubSpot's Native Reporting Stops Short
HubSpot's custom report builder is useful within its model. Pick a primary object (contacts, deals, companies, tickets, or activities), optionally bring in one associated object, and filter or group from there. For most operational reports - pipeline by stage, contacts by lifecycle, ticket volume by queue - that is enough.
Cross-functional revenue operations is not most operational reports.
The moment a RevOps team asks a question that spans pipeline, engagement history, and renewal health at the same time, the native report builder hits a wall that cannot be worked around:
No joins across more than two object types. HubSpot can pair deals with companies, or contacts with email events, but it cannot join deals, contacts, tickets, and marketing email events in one result set. The association model exists in the underlying database; the reporting UI does not expose it as a join surface.
No aggregate-of-aggregates. HubSpot can count open tickets per contact. It cannot then group those contacts by deal stage and compute average ticket count per stage: that second-level aggregation is not expressible in the report builder.
No window functions. Ranking deals by pipeline contribution within a rep's territory, or calculating a rolling 90-day win rate per team, requires SQL window functions. The native report builder does not expose them.
No CTEs or subqueries. Every native HubSpot report runs against a single denormalized pass of the data. There is no mechanism to build intermediate result sets that feed into subsequent calculations.
Step One: Sync HubSpot to SQL Server
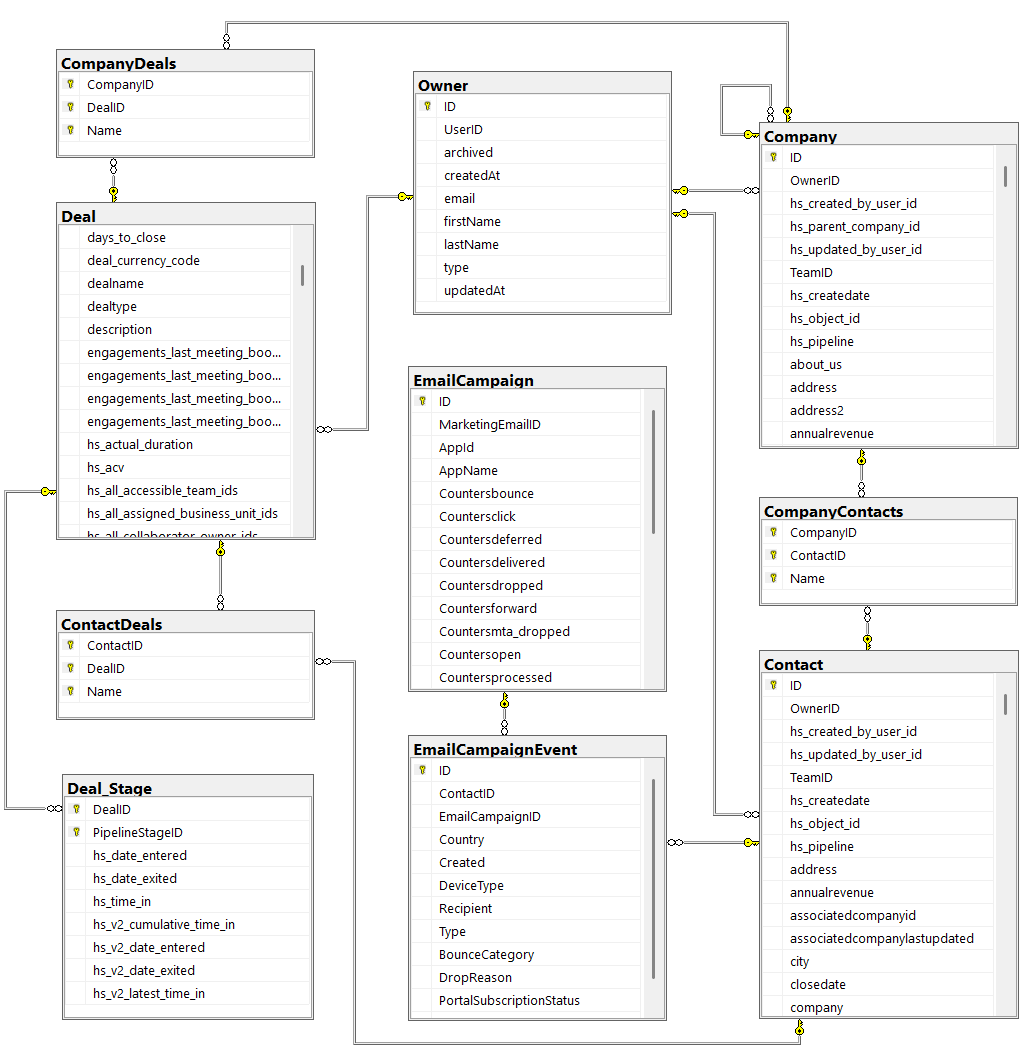
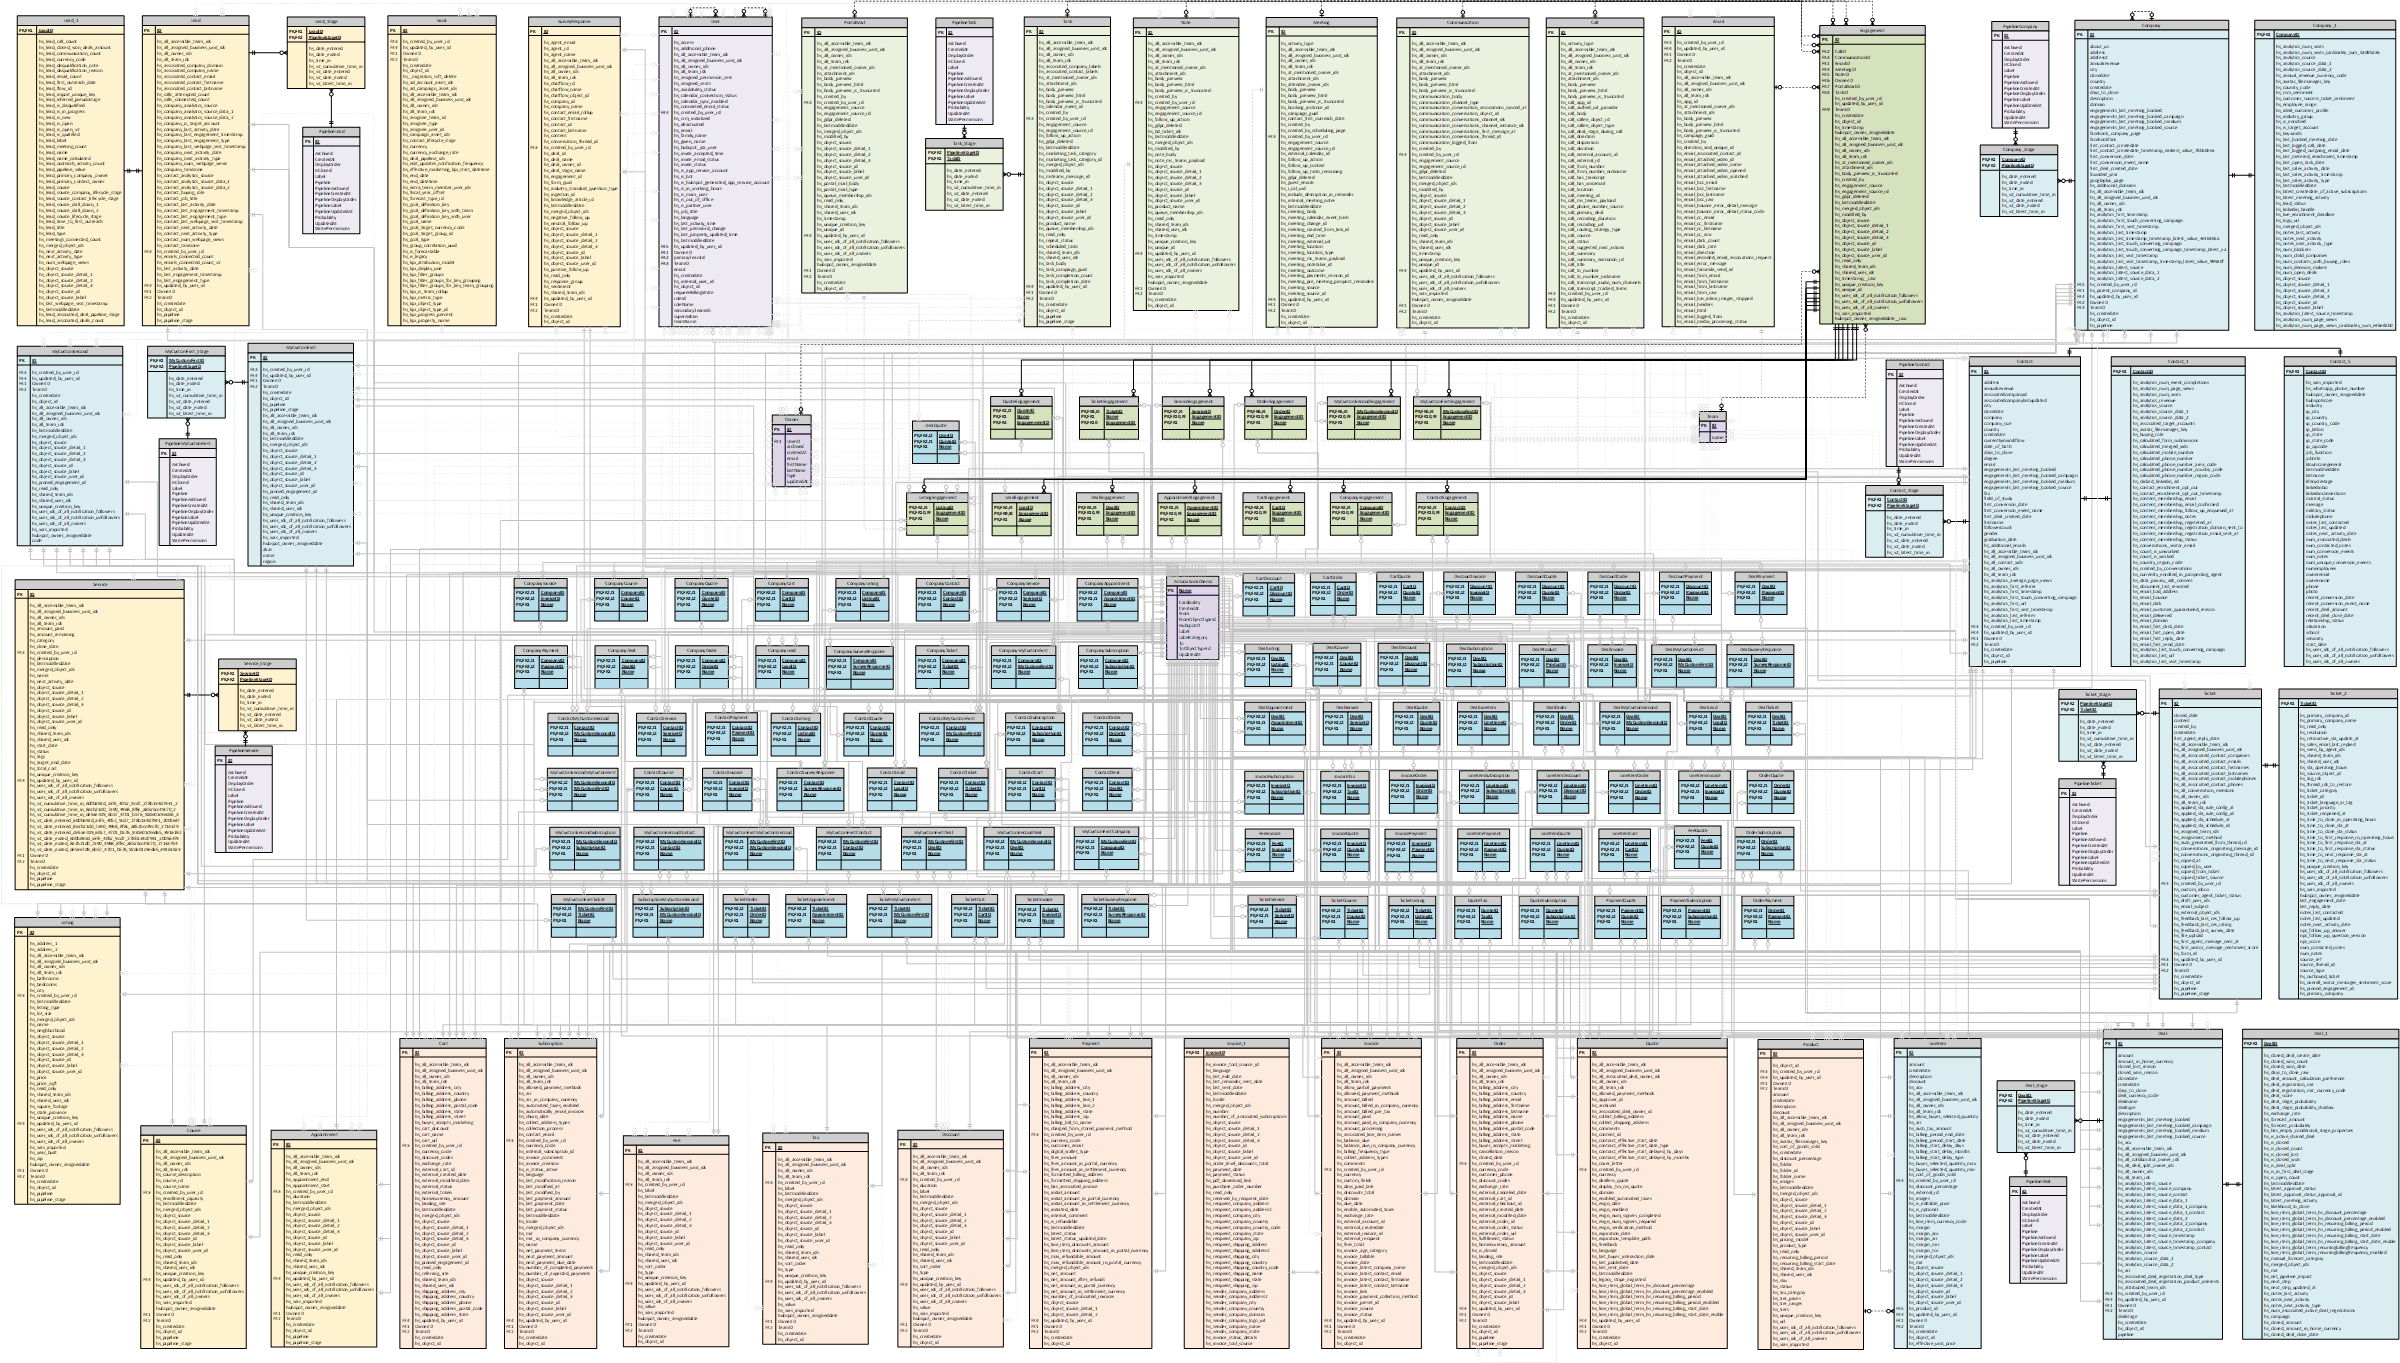
Before any cross-functional join can happen, HubSpot's object graph needs to land in a relational database with proper foreign-key relationships. AI Context Bridge for HubSpot handles this through an OAuth connection to your HubSpot portal. Once authorized, it syncs each HubSpot object type into its own table in a real Microsoft SQL Server database: separate tables for deals, contacts, companies, tickets, and marketing email events, plus junction tables for the association relationships HubSpot maintains between them.
The result is not a flat export or a JSON blob. A deal associated with multiple contacts produces rows in a deal_contact_associations junction table. A ticket linked to a contact and a company produces corresponding rows in association tables for both relationships. The relational structure that HubSpot uses internally is preserved in the SQL schema: which is exactly what makes joins across those tables possible.

The Three Joins That Build a Unified Revenue View
The queries below are representative. Every HubSpot portal has some variation in custom property names and pipeline stage identifiers. What matters here is the pattern: how CTEs isolate each data domain, how joins connect them through the association tables, and what questions become answerable once the data is relational.
Query 1: Pipeline at Risk - Deal Stage + CS Ticket Signals
The most operationally urgent cross-functional question in most RevOps shops: which active deals have counterparts in customer success that suggest the underlying relationship is already under strain?
WITH active_deals AS (
    SELECT
        d.hs_object_id          AS deal_id,
        d.dealname,
        d.amount,
        d.dealstage,
        d.closedate,
        dca.contact_id
    FROM deals d
    JOIN deal_contact_associations dca
        ON d.hs_object_id = dca.deal_id
    WHERE d.dealstage NOT IN ('closedwon', 'closedlost')
),
cs_risk AS (
    SELECT
        tca.contact_id,
        COUNT(*)                                              AS open_tickets,
        SUM(CASE WHEN t.hs_ticket_priority = 'HIGH'
                 THEN 1 ELSE 0 END)                         AS high_priority_tickets,
        MAX(t.createdate)                                    AS latest_ticket_date
    FROM tickets t
    JOIN ticket_contact_associations tca
        ON t.hs_object_id = tca.ticket_id
    WHERE t.hs_pipeline_stage NOT IN ('Closed', 'Resolved')
    GROUP BY tca.contact_id
)
SELECT
    ad.dealname,
    ad.amount,
    ad.dealstage,
    ad.closedate,
    cs.open_tickets,
    cs.high_priority_tickets,
    cs.latest_ticket_date
FROM active_deals ad
LEFT JOIN cs_risk cs
    ON ad.contact_id = cs.contact_id
ORDER BY cs.high_priority_tickets DESC, ad.amount DESC;
A $120,000 deal in the Proposal stage alongside three open high-priority CS tickets is a very different situation than that same deal viewed in isolation from the deals dashboard. Sales and CS are looking at the same customer from different HubSpot inboxes, with no native mechanism to combine those signals.
Query 2: Marketing Engagement Decay on Open Deals
This query identifies active pipeline deals where the associated contact's marketing email engagement has declined over the previous 60 days: a leading indicator that a prospect is going cold before the deal formally stalls.
WITH deal_contacts AS (
    SELECT
        d.hs_object_id  AS deal_id,
        d.dealname,
        d.amount,
        d.dealstage,
        dca.contact_id
    FROM deals d
    JOIN deal_contact_associations dca
        ON d.hs_object_id = dca.deal_id
    WHERE d.dealstage NOT IN ('closedwon', 'closedlost')
),
engagement_window AS (
    SELECT
        contact_id,
        SUM(CASE WHEN sent_at >= DATEADD(day, -30, GETDATE())
                 THEN opens ELSE 0 END)                         AS opens_last_30d,
        SUM(CASE WHEN sent_at >= DATEADD(day, -60, GETDATE())
                  AND sent_at  < DATEADD(day, -30, GETDATE())
                 THEN opens ELSE 0 END)                         AS opens_prior_30d
    FROM marketing_email_events
    GROUP BY contact_id
)
SELECT
    dc.dealname,
    dc.amount,
    dc.dealstage,
    ew.opens_last_30d,
    ew.opens_prior_30d,
    ew.opens_prior_30d - ew.opens_last_30d                      AS engagement_drop
FROM deal_contacts dc
LEFT JOIN engagement_window ew
    ON dc.contact_id = ew.contact_id
WHERE ew.opens_prior_30d > ew.opens_last_30d
ORDER BY engagement_drop DESC;
Marketing can see email engagement by contact. Sales can see deal stage by deal. Neither team can see both columns in the same row. This query closes that gap in a way no native HubSpot report can replicate.
Query 3: Aggregate Pipeline Exposure by CS Risk Tier
This is the aggregate-of-aggregates question the native HubSpot report builder cannot express. Rather than asking how many tickets a specific contact has, it asks: for each level of CS severity across all open tickets, what is the total pipeline value of associated active deals?
WITH contact_risk_tier AS (
    SELECT
        tca.contact_id,
        CASE
            WHEN MAX(CASE WHEN t.hs_ticket_priority = 'HIGH'
                         THEN 1 ELSE 0 END) = 1 THEN 'High'
            WHEN MAX(CASE WHEN t.hs_ticket_priority = 'MEDIUM'
                         THEN 1 ELSE 0 END) = 1 THEN 'Medium'
            ELSE 'Low / None'
        END AS risk_tier
    FROM tickets t
    JOIN ticket_contact_associations tca
        ON t.hs_object_id = tca.ticket_id
    WHERE t.hs_pipeline_stage NOT IN ('Closed', 'Resolved')
    GROUP BY tca.contact_id
),
deal_exposure AS (
    SELECT
        dca.contact_id,
        SUM(d.amount)   AS pipeline_value,
        COUNT(*)        AS deal_count
    FROM deals d
    JOIN deal_contact_associations dca
        ON d.hs_object_id = dca.deal_id
    WHERE d.dealstage NOT IN ('closedwon', 'closedlost')
    GROUP BY dca.contact_id
)
SELECT
    crt.risk_tier,
    SUM(de.pipeline_value)   AS total_pipeline_at_risk,
    SUM(de.deal_count)       AS deals_at_risk,
    AVG(de.pipeline_value)   AS avg_deal_size
FROM contact_risk_tier crt
JOIN deal_exposure de
    ON crt.contact_id = de.contact_id
GROUP BY crt.risk_tier
ORDER BY
    CASE crt.risk_tier
        WHEN 'High'   THEN 1
        WHEN 'Medium' THEN 2
        ELSE 3
    END;
The output is a three-row summary: total pipeline exposure, deal count, and average deal size for each CS risk tier. Whether the High row shows $200,000 or $2 million in exposed pipeline changes how a CRO talks to CS leadership in a QBR. Neither number exists anywhere in HubSpot's native reporting.
Asking These Questions Without Writing SQL
The queries above are correct and runnable, but RevOps teams do not need SQL fluency to get these answers. DataLabs.store's AI Context Bridge routes plain-English prompts to Claude or ChatGPT through an MCP endpoint. The AI writes the SQL against the synchronized HubSpot database, executes it, and returns the answer alongside the underlying query so it can be inspected.
A prompt like "show me all open deals where the contact has a high-priority CS ticket open, sorted by deal value" produces a join structurally equivalent to Query 1 above. The query is visible in the response, which means it can be audited, handed to a data engineer, or refined with a follow-up question such as "now filter to deals closing this quarter."
This matters practically for two reasons. First, it makes cross-functional queries accessible to anyone on the RevOps team, not just whoever knows the association table schema. Second, every answer is backed by inspectable SQL: when a pipeline number needs to be defended in a forecast review, there is an actual query behind it, not a black-box dashboard calculation.
What a Unified Revenue View Changes in Practice
The three queries in this post represent the same structural problem stated three different ways: HubSpot stores sales, marketing, and CS data relationally, but its native reporting exposes each object type in isolation. Connecting those objects into a single view requires a relational database and SQL joins.
Once that infrastructure exists, the cross-functional questions that RevOps teams actually care about - pipeline at risk, engagement decay, aggregate exposure by CS tier - become routine queries rather than manual data pulls across three separate HubSpot dashboards stitched together in a spreadsheet.
The operational payoff scales with how often those questions get asked. Teams that run weekly pipeline reviews, monthly forecast calls, and quarterly business reviews gain the most from a query-ready, joined view of their revenue data. The alternative is a recurring manual reconciliation exercise: one that every RevOps practitioner managing HubSpot at scale already knows by heart.