
Your pipeline board shows a number. What it does not show is whether that number is moving.
A deal sitting at 70% probability for eight months is not the same as a deal that entered that stage last week and is progressing on schedule. Yet in most HubSpot reporting setups those two deals contribute identical dollar amounts to the forecast: one actively heading toward close, the other silently decaying. This is the core limitation of static pipeline weighting: it collapses every deal into a single, time-independent probability, which means pipeline velocity - how fast deals actually move through stages relative to your team's historical baseline - is invisible to it.
This post explains what velocity analysis actually requires, shows the SQL window functions that make it possible, and explains why DataLabs.store's AI Context Bridge for HubSpot can answer these questions from a plain-English prompt while HubSpot's native report builder cannot.
The Static-Weight Problem Is Bigger Than You Think
Before addressing velocity, it is worth being precise about the foundation these forecasts rest on: the stage win probabilities your CRM currently uses.
Your configured probabilities do not match what actually happens
HubSpot lets you assign a win probability to each pipeline stage. Most teams set these once - often from industry benchmarks or intuition - and never revisit them. Those configured numbers rarely reflect how deals actually close.
We ran a calibration query against the DataLabs DEMO HubSpot portal (2,212 historical deals):
| Stage | Configured Probability | Actual Win Rate | Sample |
| Main Pipeline / On Hold | 10% | 0.0% | 27 deals |
| Migration / Trial (early) | 25% | 20.5% | 234 deals |
| Migration / Trial (mid) | 50% | 47.2% | 72 deals |
| Migration / Proposal | 70% | 62.7% | 118 deals |
Every stage runs hotter than reality. The On Hold stage is the starkest example: the CRM assigns it 10% probability, but across 27 historical deals that passed through it, the actual close rate is 0%. Every dollar sitting in On Hold is worth nothing in expectation - and your forecast is counting it at 10 cents on the dollar.
Producing this table requires a join between your deals and your pipeline stage definitions, aggregated across closed deals with a minimum-sample filter. That is at minimum a two-table join with a HAVING clause: a query structure the standard HubSpot report builder cannot express.
Your rep leaderboard is built on the wrong number
Even if you trusted the configured stage probabilities, your pipeline misleads you in a second way: it treats all reps' deals as equally likely to close, when actual close rates vary dramatically by rep.
We ran a win-rate-weighted pipeline query against the same DEMO portal. By raw open pipeline value:
- Peter Castillo, $2,382,650 across 53 open deals
- Robin Lamb, $2,069,731
- (others)
- Nala Phillips, $1,291,390 across 6 open deals
Now weight each rep's open pipeline by their own actual historical win rate from the past 12 months:
- Nala Phillips, $979,079 weighted (77.9% historical win rate)
- (others)
- Peter Castillo, $536,472 weighted (19.4% historical win rate)
Robin Lamb's $2,069,731 raw pipeline collapses to $204,048 weighted. Ninety percent of her apparent book evaporates against her actual close history.
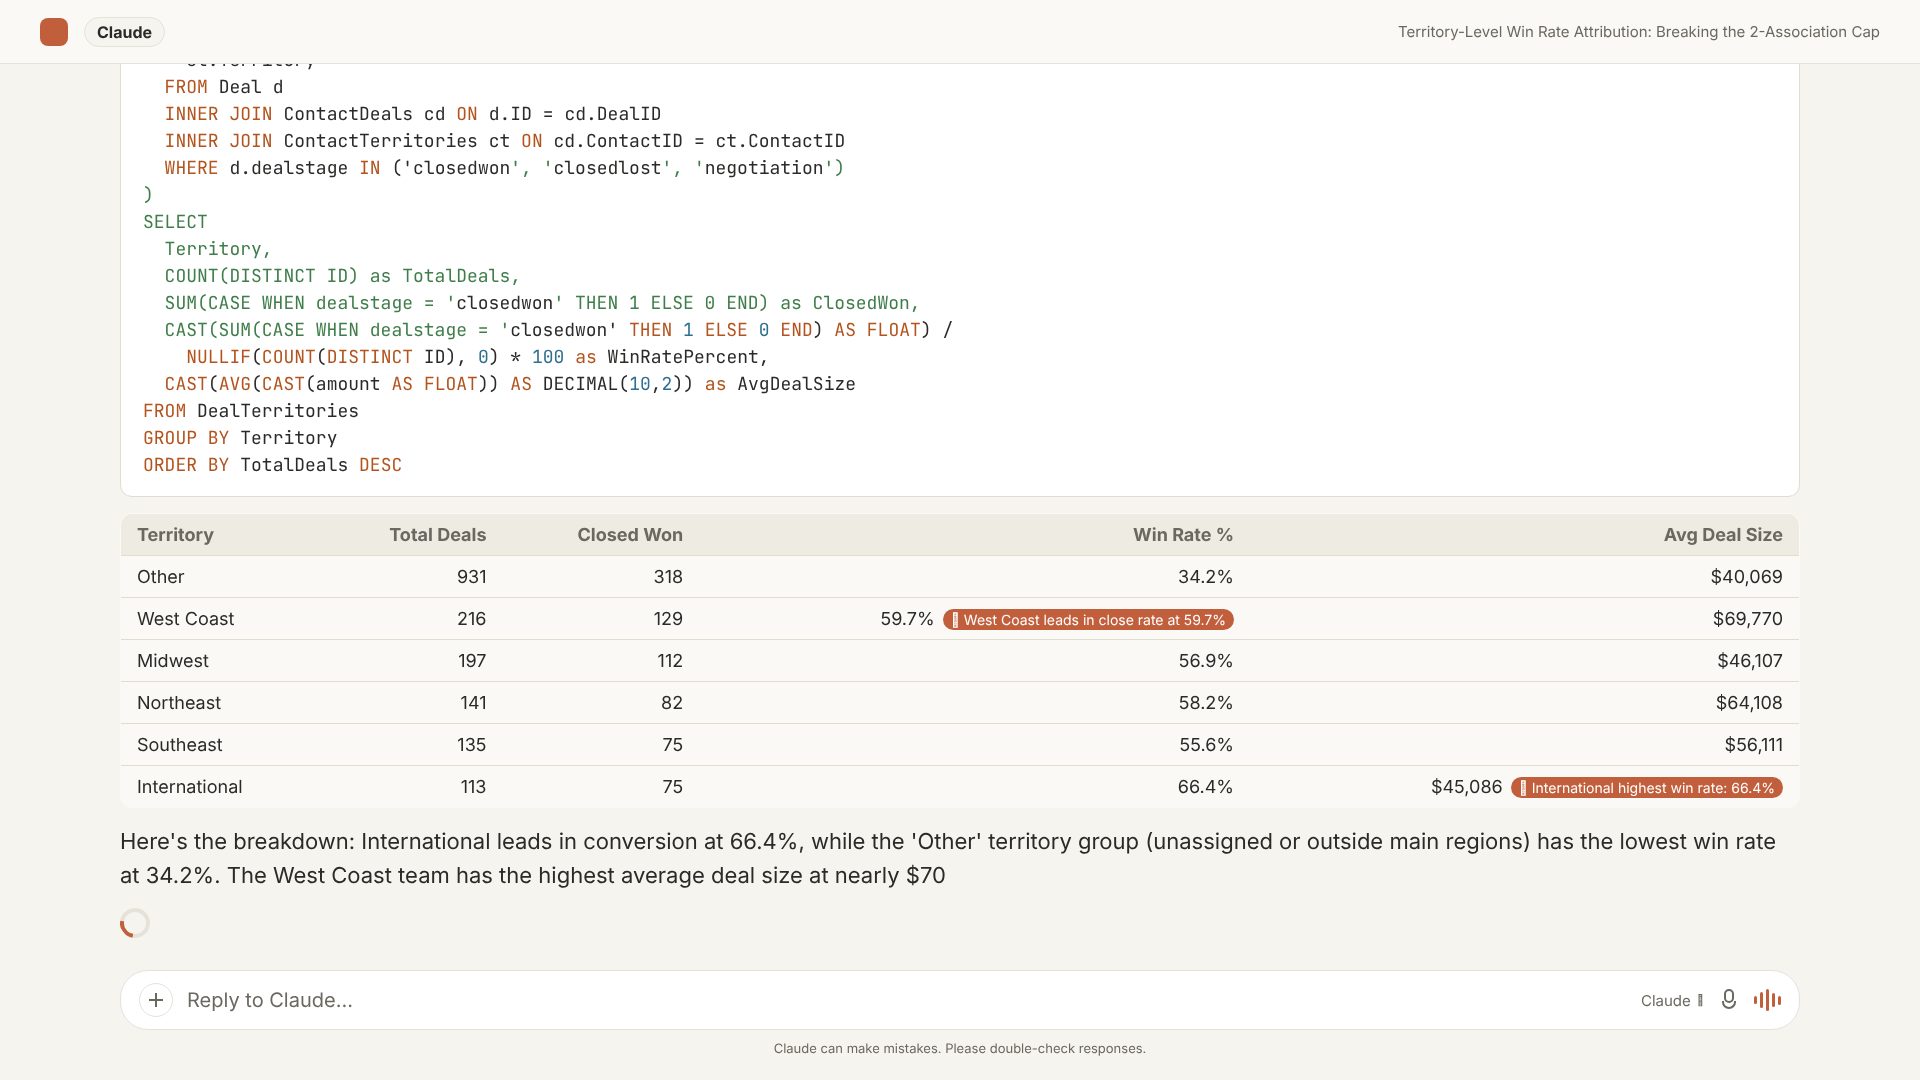
Computing the weighted value requires joining every open deal to a CTE that calculates each owner's historical close rate, then multiplying deal amount by that rate. HubSpot's single-object report builder cannot express that join.
What Pipeline Velocity Actually Measures
Both problems above are time-independent: they describe what your pipeline is worth today. Velocity adds the longitudinal dimension. A deal in Proposal that has been there 60 days, when the historical median for that stage is 14 days, is not a healthy 70% deal. It is a deal with a velocity problem that should surface in your weekly review before it becomes a missed forecast. Tracking days-in-stage against historical baselines turns a static balance sheet into an early-warning system.
The SQL That Makes Velocity Visible
Step 1: Stage-transition history as the foundation
Velocity analysis starts with the deal stage history: a timestamped record of every stage transition a deal made. In the SQL Server database that AI Context Bridge produces from your HubSpot portal, this is hs_deal_stage_history: a table with a row per stage-entry event per deal, with proper foreign key relationships to your deals and pipeline definitions.
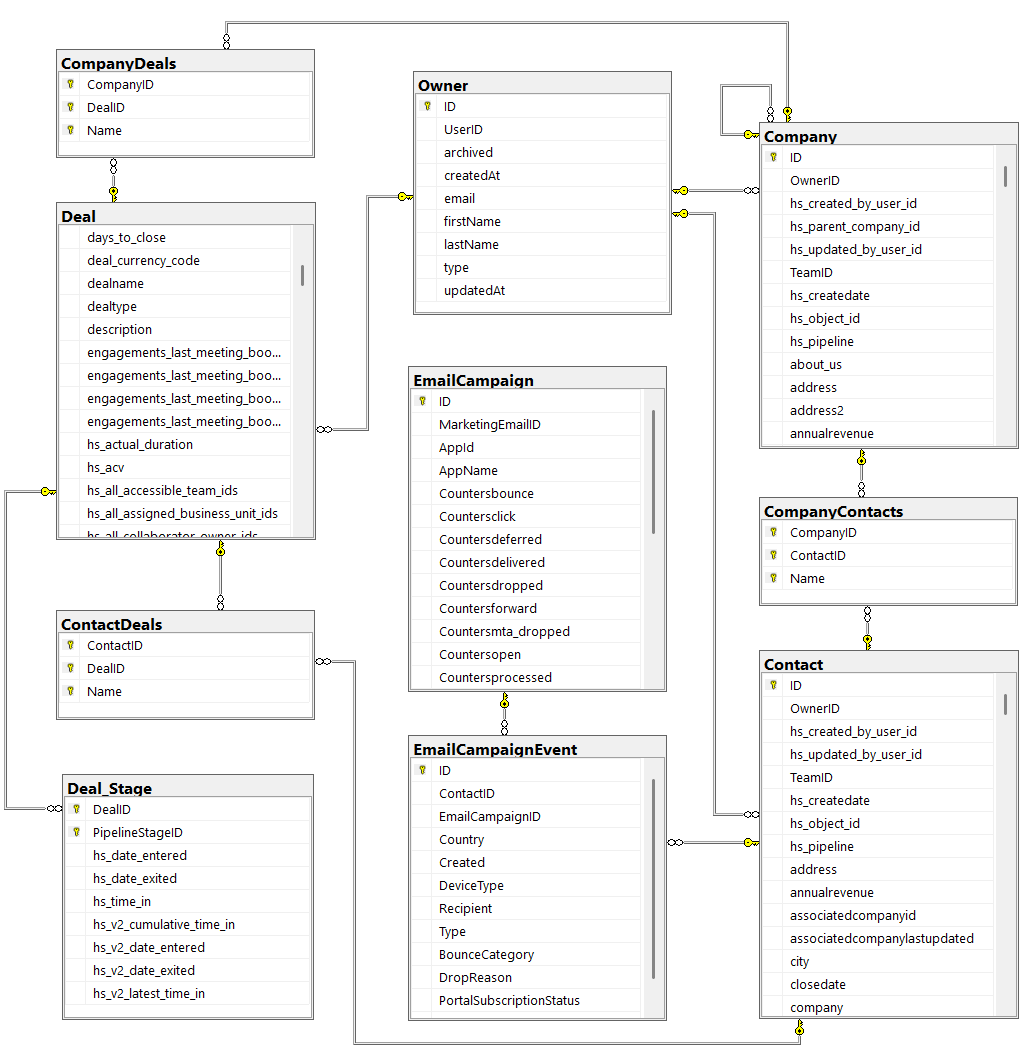
Step 2: Compute average days per stage
The baseline query uses LAG() - a window function that retrieves the previous row's value within a partition - to compute how long each deal spent in each stage:
WITH stage_durations AS (
    SELECT
        deal_id,
        stage_name,
        DATEDIFF(day,
            LAG(entered_at) OVER (PARTITION BY deal_id ORDER BY entered_at),
            entered_at
        ) AS days_in_stage
    FROM hs_deal_stage_history
)
SELECT
    stage_name,
    COUNT(*) AS transitions,
    ROUND(AVG(CAST(days_in_stage AS FLOAT)), 1) AS avg_days_in_stage,
    MAX(days_in_stage) AS max_days_in_stage
FROM stage_durations
WHERE days_in_stage > 0
GROUP BY stage_name
ORDER BY avg_days_in_stage DESC;
LAG(entered_at) OVER (PARTITION BY deal_id ORDER BY entered_at) retrieves the timestamp when the same deal entered its previous stage. DATEDIFF() computes the elapsed days. The outer query averages those durations by stage across your full deal history, giving you a realistic baseline per stage.
Step 3: Flag stalled open deals
With stage baselines computed, you can rank every open deal by how much longer it has been sitting in its current stage than normal:
WITH stage_durations AS (
    SELECT
        deal_id,
        stage_name,
        DATEDIFF(day,
            LAG(entered_at) OVER (PARTITION BY deal_id ORDER BY entered_at),
            entered_at
        ) AS days_in_stage
    FROM hs_deal_stage_history
),
stage_baselines AS (
    SELECT
        stage_name,
        AVG(CAST(days_in_stage AS FLOAT)) AS avg_days_in_stage
    FROM stage_durations
    WHERE days_in_stage > 0
    GROUP BY stage_name
),
current_stage AS (
    SELECT deal_id, stage_name, entered_at
    FROM hs_deal_stage_history
    WHERE is_current_stage = 1
)
SELECT
    d.dealname,
    d.amount,
    o.firstname + ' ' + o.lastname AS owner,
    cs.stage_name,
    DATEDIFF(day, cs.entered_at, GETDATE()) AS current_days_in_stage,
    ROUND(b.avg_days_in_stage, 1) AS stage_average_days,
    ROUND(
        CAST(DATEDIFF(day, cs.entered_at, GETDATE()) AS FLOAT)
            / NULLIF(b.avg_days_in_stage, 0),
        1
    ) AS velocity_ratio
FROM current_stage cs
JOIN hs_deals d ON cs.deal_id = d.hs_object_id
JOIN hs_owners o ON d.hubspot_owner_id = o.owner_id
JOIN stage_baselines b ON cs.stage_name = b.stage_name
WHERE d.dealstage NOT IN ('closedwon', 'closedlost')
ORDER BY velocity_ratio DESC;
velocity_ratio above 1.0 means a deal is aging slower than normal for its stage. A ratio of 3.0 means it has spent three times longer there than the historical average. This is the list you bring into your weekly pipeline review.
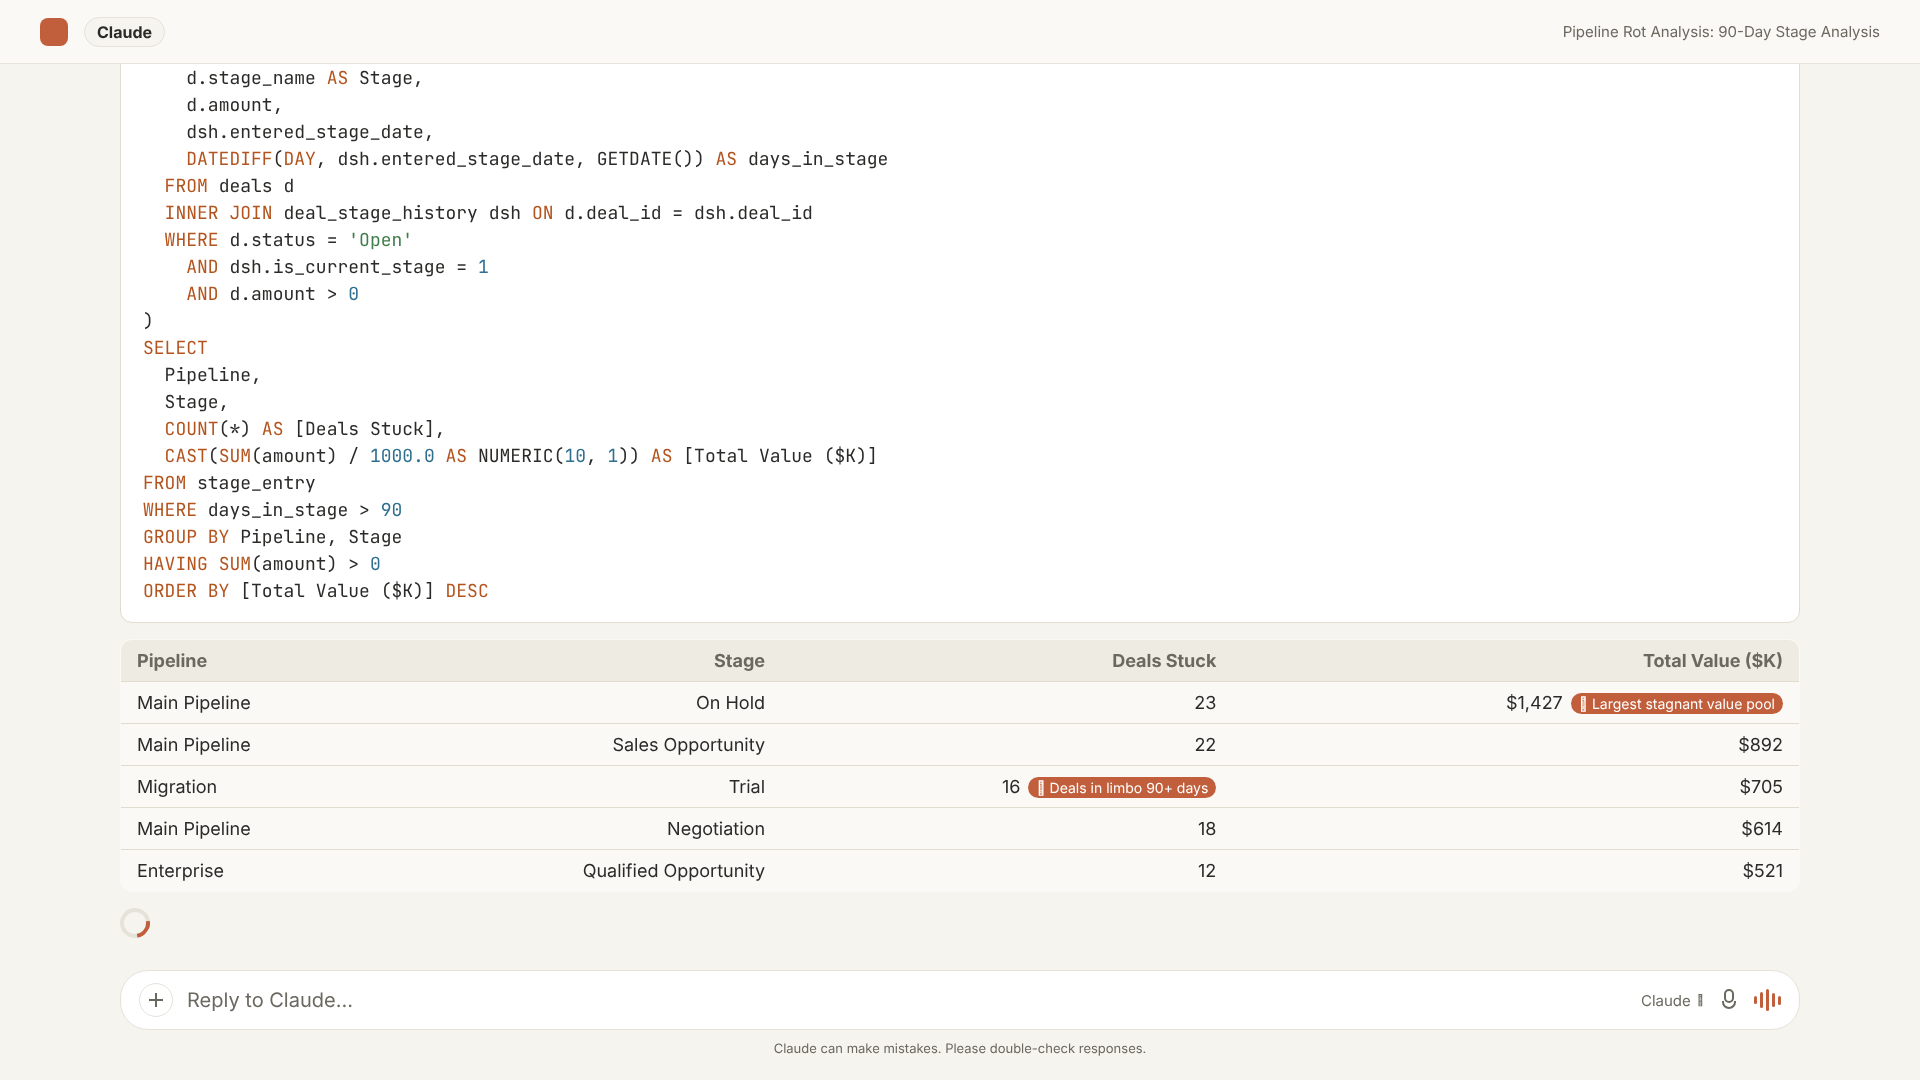
Step 4: Calibrate your stage weights against reality
The same schema supports the forecast calibration from the opening section: comparing configured stage probabilities to actual close rates:
SELECT
    ps.label AS stage_name,
    ROUND(ps.probability * 100, 1) AS configured_probability_pct,
    ROUND(
        100.0 * SUM(CASE WHEN d.dealstage = 'closedwon' THEN 1 ELSE 0 END)
            / COUNT(d.hs_object_id),
        1
    ) AS actual_win_rate_pct,
    ROUND(
        ps.probability * 100
        - 100.0 * SUM(CASE WHEN d.dealstage = 'closedwon' THEN 1 ELSE 0 END)
            / COUNT(d.hs_object_id),
        1
    ) AS overstatement_pct,
    COUNT(d.hs_object_id) AS historical_deals
FROM hs_deals d
JOIN hs_deal_pipeline_stages ps
    ON d.hs_pipeline_id = ps.pipeline_id
    AND d.dealstage = ps.stage_id
WHERE d.closedate IS NOT NULL
    AND d.closedate < GETDATE()
GROUP BY ps.label, ps.probability, ps.stage_id
HAVING COUNT(d.hs_object_id) >= 20
ORDER BY overstatement_pct DESC;
Why HubSpot's Native Reporting Cannot Do This
Each query above depends on at least one capability the standard HubSpot report builder cannot express:
- Stage-transition history: HubSpot does not expose the deal stage history as a reportable object. You can see the current stage value on a deal, but not the timestamped sequence it moved through.
- Window functions:
LAG(),LEAD(), andRANK() OVER (PARTITION BY ...)compute values relative to other rows in the same result set. HubSpot's report builder has no equivalent: every metric is a summary statistic over a flat record set. - Common table expressions: The velocity and calibration queries above use CTEs to break multi-step computations into named stages. HubSpot's report builder has no equivalent: each report is a single-level aggregation over one or two CRM objects.
- Multi-table joins: Joining deals to stage-history entries to stage-definition metadata to owner records is a four-table join. Even HubSpot's Enterprise-tier custom report builder caps cross-object paths and cannot express arbitrary join chains.
HubSpot's native reporting answers snapshot questions: how many deals are in each stage right now, what is the total pipeline value per rep. Velocity analysis asks longitudinal questions: how long have they been there, is that normal for this stage, and which ones are falling behind. Those are not extensions of the same query model.

How AI Context Bridge Brings This to Revenue Teams
AI Context Bridge for HubSpot is a two-part system. The sync layer connects to your HubSpot portal via OAuth and replicates your CRM data - deals, contacts, companies, pipeline stage definitions, deal stage history, owners, associations - into a real Microsoft SQL Server database with properly normalized tables and foreign key relationships. Not a flat export, not a JSON blob.
The MCP endpoint then exposes that SQL Server database to Claude or ChatGPT via a Model Context Protocol connection. You type a plain-English question; the AI writes the appropriate T-SQL, executes it against your actual HubSpot data, and returns the result alongside the query it used. You can audit every number.
A RevOps analyst who wants the velocity analysis does not need to write the window-function query themselves. They ask: "Show me our open deals ranked by how much longer they have been in their current stage compared to the historical average for that stage." The AI writes the CTE-plus-LAG query, runs it, and returns a sortable table with velocity ratios for every open deal. If a number looks wrong, you can read the query, understand what it computed, and ask a follow-up question to refine it.
Getting Started
If your pipeline board shows a static number and your forecast relies on stage probabilities set years ago, the fastest way to understand whether those numbers hold is to run a calibration query against your own deal history.
AI Context Bridge for HubSpot syncs your HubSpot portal to SQL Server and exposes it through a Claude or ChatGPT MCP endpoint. Pricing starts at $0 per month for the daily sync tier.