
Every quarter, RevOps teams at HubSpot shops go through the same ritual. Pull a deal export. Pull a contact export with source fields. Pull a ticket export from CS. Open Excel, write VLOOKUPs to connect them, discover three contacts that didn't match on merge, debug the mismatch, and spend two hours producing a set of slides that will be questioned in the room because the CRO's mental model of the pipeline doesn't match what the spreadsheet says.
The data for a defensible QBR exists in HubSpot. Every deal, every stage transition, every source attribution, every CS ticket. It is all there. The problem is that HubSpot's native reporting engine is structurally single-object. You can build a report on deals, or a report on contacts, or a report on tickets, but you cannot build one that joins a deal to the contact who originated it, computes a win rate by lead source, and checks whether any of those contacts have open high-priority CS tickets. That cross-object analysis requires relational SQL.
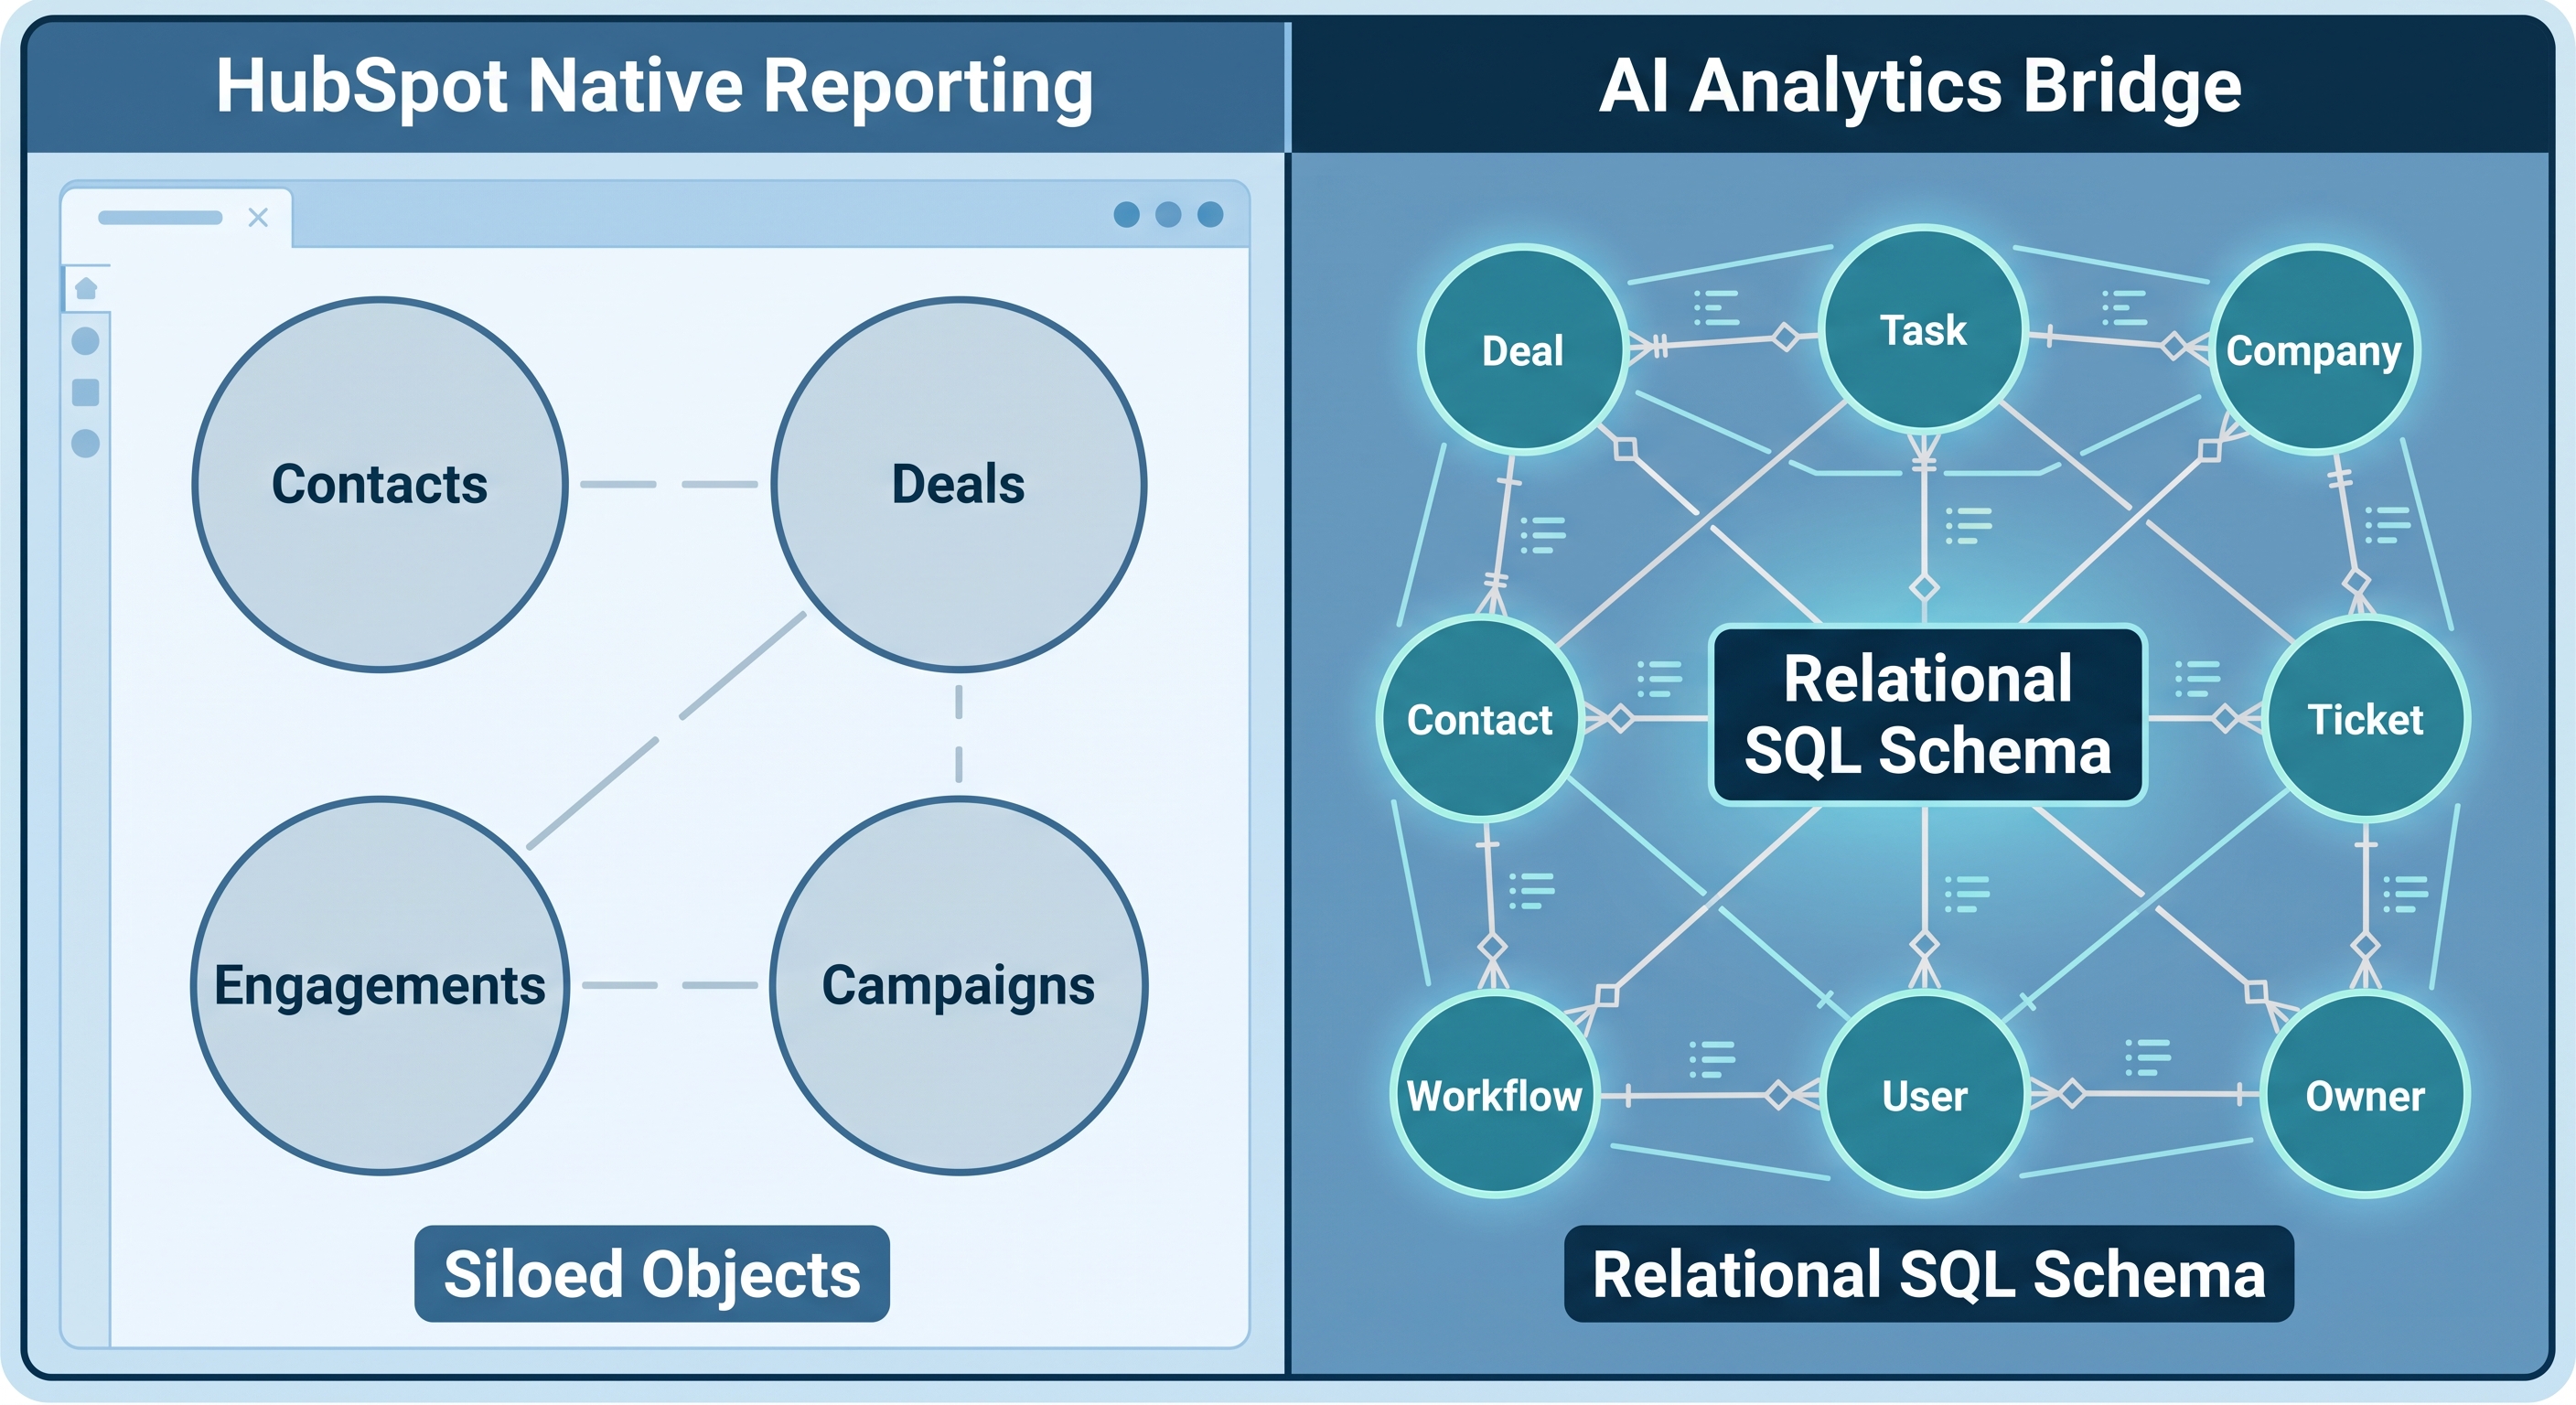
What a Complete QBR Requires
A defensible quarterly business review needs three analytical outputs that HubSpot native reporting cannot produce in a single view:
Marketing-attributed pipeline with win rates. Not just which deals are tagged to a source: what did each source actually close, and at what conversion rate? Computing win rate per source requires dividing a count of closed-won deals by a count of all deals for that source: an aggregate-of-aggregates calculation that HubSpot Enterprise explicitly does not support.
Stage conversion and pipeline health. Where in the funnel is the business losing opportunities, and how much total pipeline value has been sitting in a single stage past 90 days? The stage history data exists in HubSpot, but accessing it for all deals simultaneously requires the deal stage history table.
Revenue at risk from CS signals. Which open deals in the pipeline belong to contacts who also have active high-priority support tickets? This is a four-table join across deals, contacts, tickets, and their respective association tables - invisible to both the sales dashboard and the CS dashboard viewed independently.
The following sections build each of these as SQL. They compose into one reproducible QBR report that replaces four manual exports.
The Data Layer: Syncing HubSpot to SQL Server
AI Context Bridge for HubSpot connects to HubSpot via OAuth and syncs your CRM into a normalized SQL Server database. The result is not a flat export or a JSON blob. It is a proper relational schema with separate tables for each HubSpot object type and explicit join tables for associations.
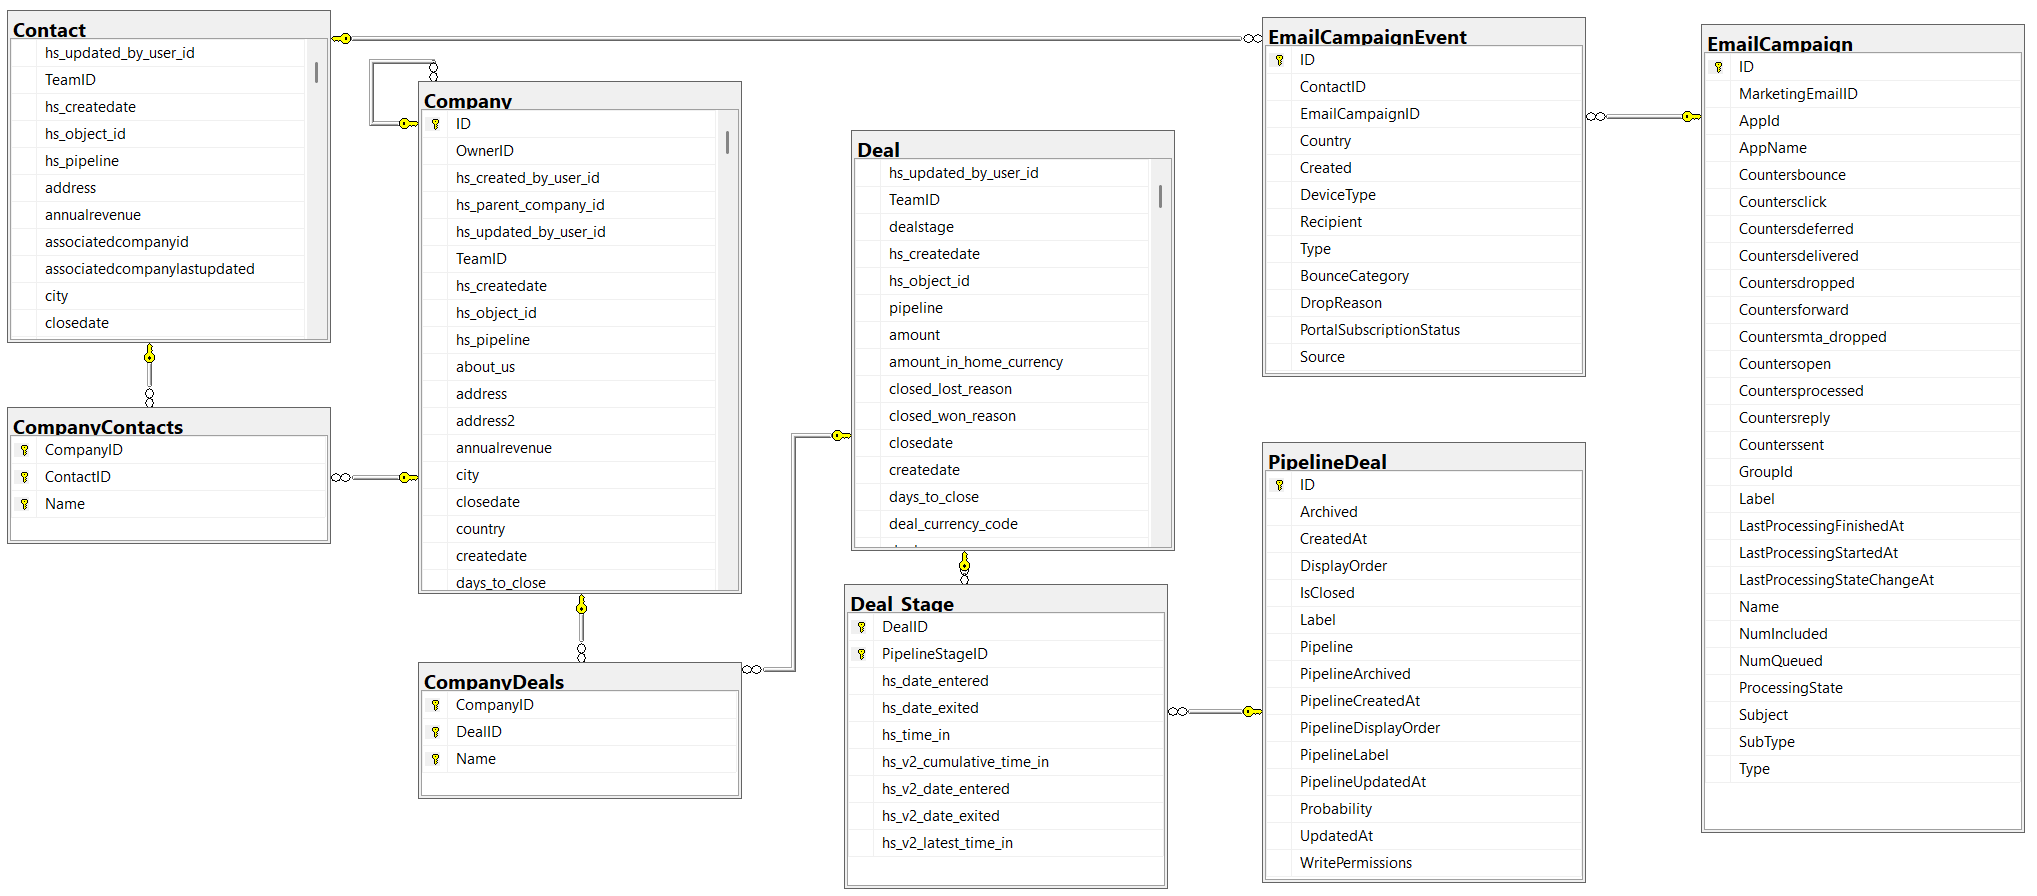
The six tables the QBR queries below depend on:
| Table | Contents |
| Deal | Deal record: amount, stage, pipeline, close date, won/lost status |
| Deal_Stage | Deal stage change history: one row per stage transition per deal, with entry and exit timestamps |
| Contact | Contact record: original source, lifecycle stage |
| ContactDeals | Join table linking each deal to its associated contacts |
| Ticket | CS ticket record: priority, pipeline status, created date |
| ContactTickets | Join table linking each ticket to its associated contacts |
None of these tables can be queried together in HubSpot's native reporting layer. All six exist in the SQL Server database after the initial sync.
Part One: Marketing Attribution with Win Rates
The first QBR section answers: which channels are generating pipeline, and which are actually closing?
HubSpot's deal reports can filter by a contact's Original Source property, but only if you export the contact data separately and link it to the deal export by hand. Even then, HubSpot's reporting engine cannot compute the win rate per source inline. Win rate is a count of closed-won deals divided by a count of all deals for each source group, which is an aggregate-of-aggregates operation that HubSpot's custom report builder prohibits explicitly.
In SQL, it is a standard GROUP BY with a ratio column:
WITH deal_primary_contact AS (
    SELECT DealID, MIN(ContactID) AS ContactID
    FROM ContactDeals
    GROUP BY DealID
),
marketing_attribution AS (
    SELECT
        c.hs_analytics_source                    AS lead_source,
        COUNT(DISTINCT d.ID)                     AS deals_created,
        SUM(CAST(d.amount AS FLOAT))             AS total_pipeline,
        SUM(CASE WHEN d.hs_is_closed_won = 'true'
                 THEN CAST(d.amount AS FLOAT) ELSE 0 END) AS closed_won_value,
        CAST(
            100.0 * CAST(SUM(CASE WHEN d.hs_is_closed_won = 'true'
                                  THEN 1 ELSE 0 END) AS FLOAT)
            / NULLIF(COUNT(DISTINCT d.ID), 0)
        AS DECIMAL(5,1))                          AS win_rate_pct
    FROM Deal d
    JOIN deal_primary_contact dpc
         ON dpc.DealID = d.ID
    JOIN Contact c
         ON c.ID = dpc.ContactID
    WHERE d.createdate >= DATEADD(QUARTER, -1, GETDATE())
    GROUP BY c.hs_analytics_source
)
SELECT *
FROM marketing_attribution
ORDER BY closed_won_value DESC;
The win_rate_pct column is what a QBR audience needs that no HubSpot report provides: not just "how much pipeline came from organic search" but "how much from organic search, and what fraction of it closed?" Two channels with identical pipeline totals can have win rates of 8% and 31%, and that gap is what drives budget and headcount decisions for the following quarter.
Part Two: Stage Conversion and Pipeline Health
The second section of the QBR tells the funnel story: where deals are stalling, and how much value is concentrated in stages past their expected duration.
HubSpot Enterprise's reporting can show average time-in-stage for a single selected stage. It cannot show all stages simultaneously, and it cannot identify which specific deals are the outliers within each stage - only the average. The Deal_Stage table contains one row per stage transition per deal, which lets a SQL query do both.
The stage rot query identifies open deals that have been in their current stage for more than 90 days, grouped by pipeline and stage, with total value concentration at each bottleneck:
WITH latest_stage_entry AS (
    SELECT
        ds.DealID,
        pd.Label              AS stage_label,
        pd.PipelineLabel      AS pipeline_label,
        ds.hs_v2_date_entered AS entered_at,
        ROW_NUMBER() OVER (
            PARTITION BY ds.DealID
            ORDER BY ds.hs_v2_date_entered DESC
        ) AS rn
    FROM Deal_Stage ds
    JOIN PipelineDeal pd
         ON pd.ID = ds.PipelineStageID
),
stalled_pipeline AS (
    SELECT
        lse.pipeline_label,
        lse.stage_label,
        COUNT(d.ID)                              AS stalled_deals,
        SUM(CAST(d.amount AS FLOAT))             AS stalled_value,
        AVG(DATEDIFF(DAY, lse.entered_at, GETDATE()))
                                                 AS avg_days_stalled
    FROM Deal d
    JOIN latest_stage_entry lse
         ON lse.DealID = d.ID
         AND lse.rn = 1
    WHERE d.hs_is_closed = 'false'
      AND DATEDIFF(DAY, lse.entered_at, GETDATE()) > 90
    GROUP BY lse.pipeline_label, lse.stage_label
    HAVING SUM(CAST(d.amount AS FLOAT)) > 0
)
SELECT *
FROM stalled_pipeline
ORDER BY stalled_value DESC;
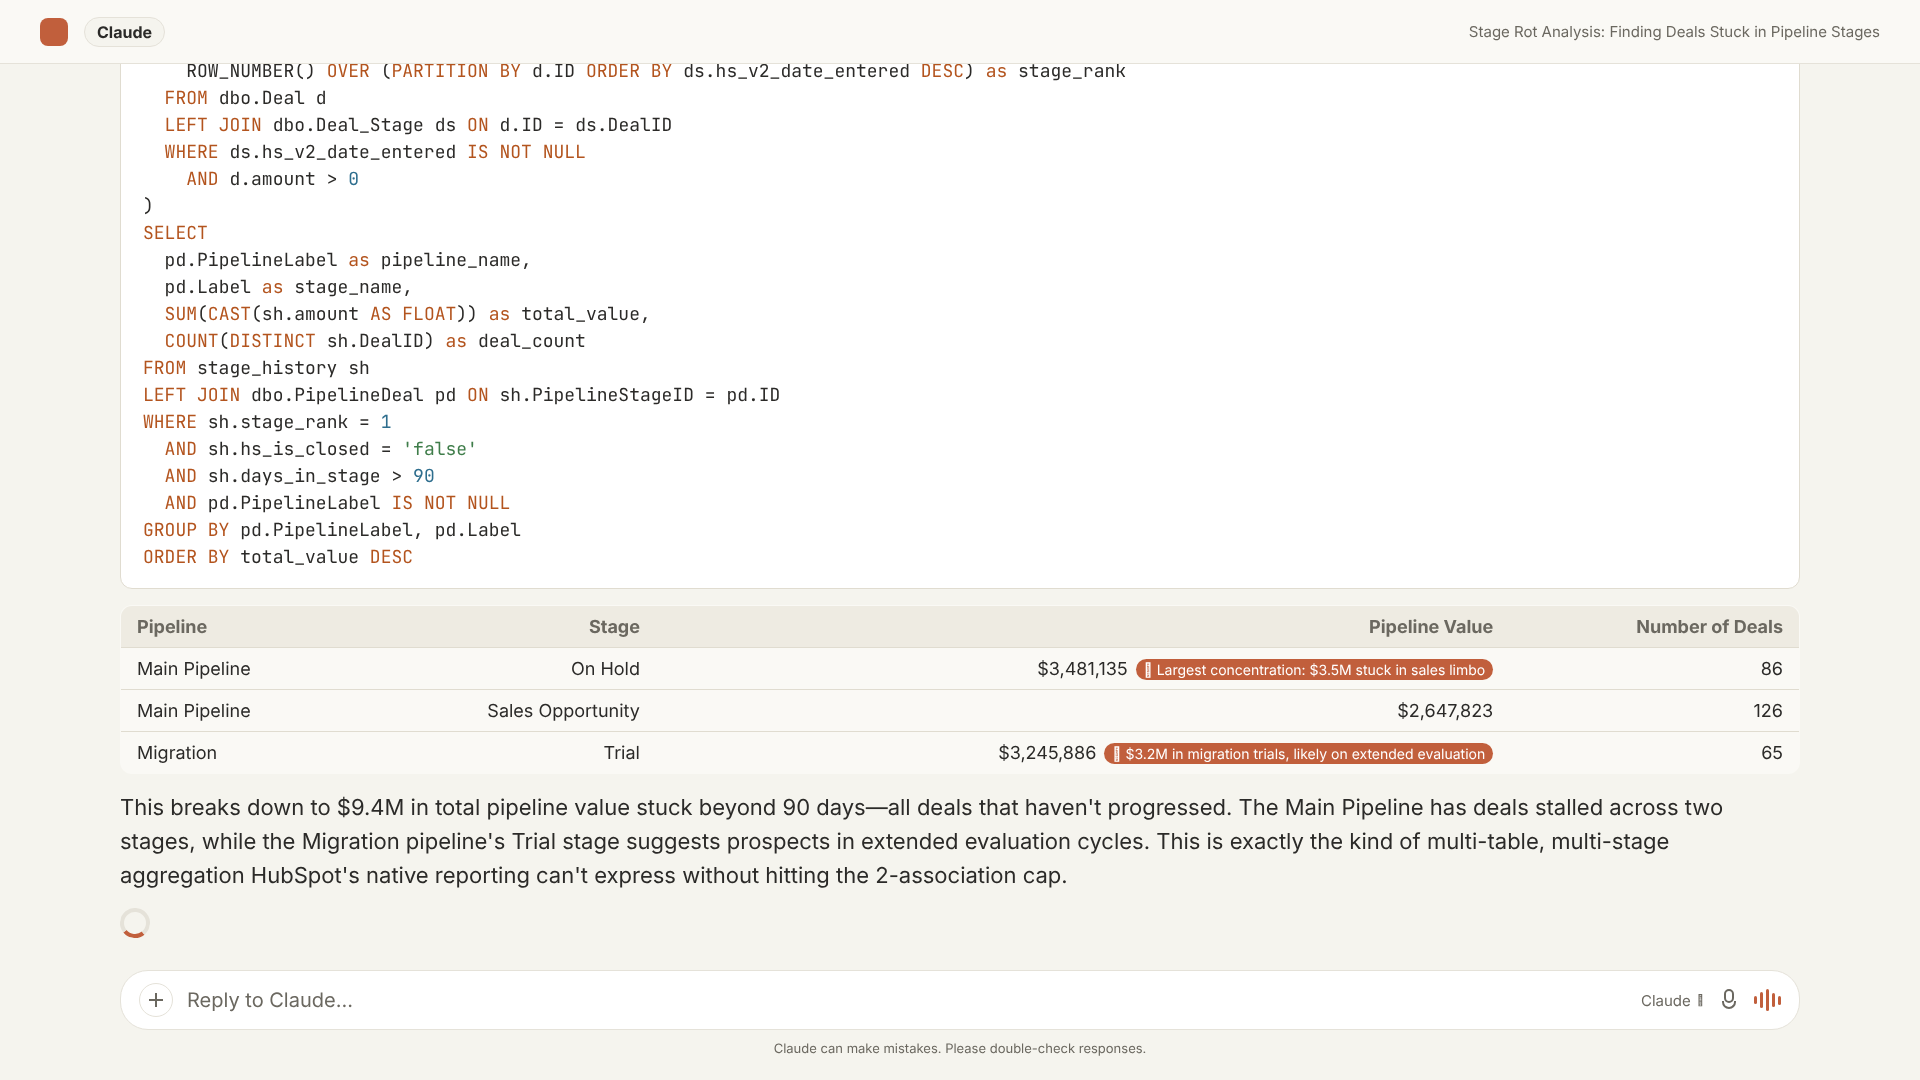
The avg_days_stalled column changes how the QBR audience interprets the number. A deal at 95 days in a stage is a monitoring item that gets added to the weekly pipeline review. A deal at 240 days is a write-off conversation that finance has probably already started separately. Having both categories visible in the same table means the QBR room can triage without scheduling a follow-up meeting to do it.
Part Three: Revenue at Risk from CS Signals
This is the QBR section most decks handle with a verbal note: "CS will give us an update on at-risk accounts." That note means the same accounts come as a surprise in the CRO's one-on-ones the following week.
The query below produces a table of open pipeline deals where the associated contact also has an open, high-priority CS ticket. It requires a four-table join that HubSpot's reporting layer cannot traverse:
WITH at_risk_pipeline AS (
    SELECT
        d.dealname,
        d.amount                                AS deal_value,
        d.dealstage,
        COUNT(t.ID)                             AS open_high_priority_tickets,
        MAX(t.createdate)                       AS latest_ticket_opened
    FROM Deal d
    JOIN ContactDeals cd
         ON cd.DealID = d.ID
    JOIN ContactTickets ct
         ON ct.ContactID = cd.ContactID
    JOIN Ticket t
         ON t.ID = ct.TicketID
    WHERE d.hs_is_closed = 'false'
      AND t.hs_is_closed = 'false'
      AND t.hs_ticket_priority = 'HIGH'
    GROUP BY d.dealname, d.amount, d.dealstage
)
SELECT *
FROM at_risk_pipeline
ORDER BY deal_value DESC;
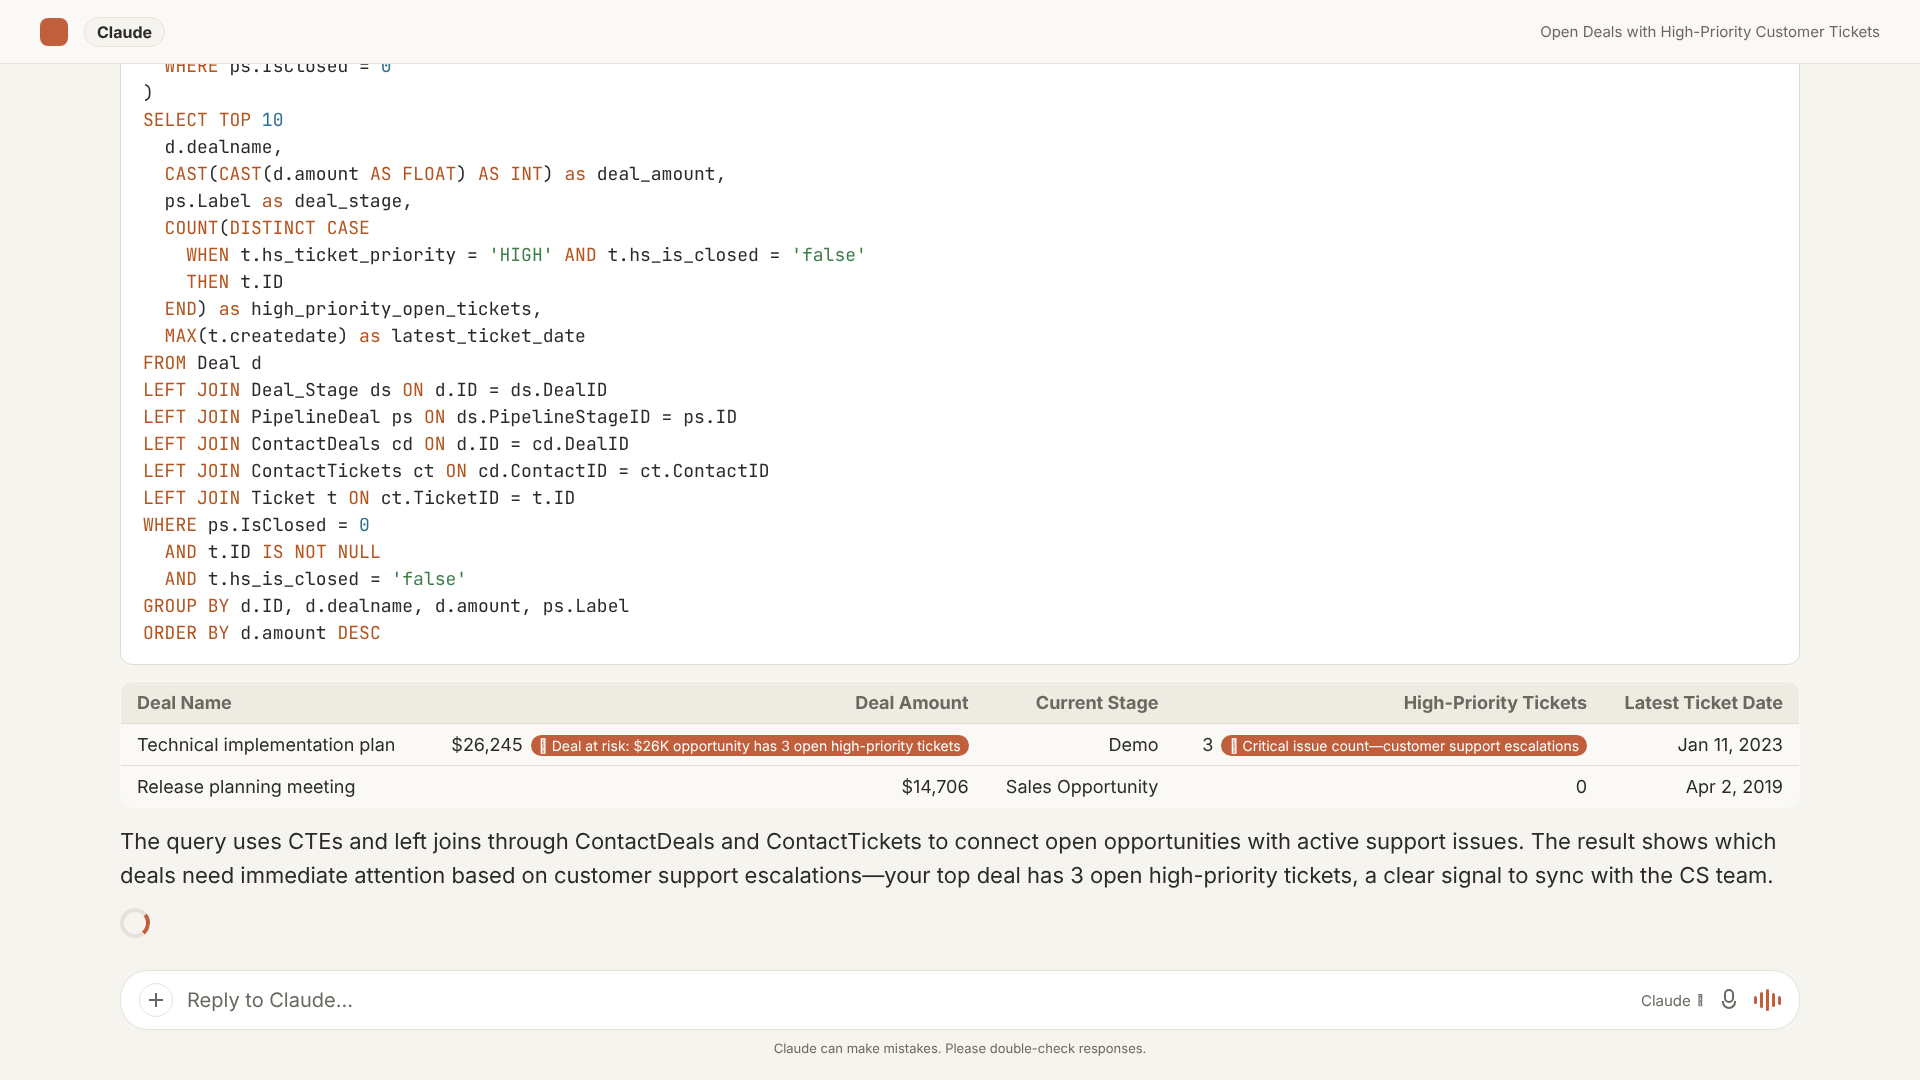
This output tends to generate the most conversation in the QBR room, because account executives and CS managers are often looking at the same accounts from different systems without knowing what the other sees. A $90,000 renewal in Proposal stage alongside 4 open high-priority tickets is a different business conversation than the same renewal with no tickets. This query makes that difference visible before the slides go out, not after the QBR.
Part Four: Forecast Calibration
One more piece belongs in a complete QBR: are the stage win probabilities configured in HubSpot's pipeline actually accurate, and is the weighted forecast number finance is modeling from them reliable?
This comparison requires joining each pipeline stage's configured probability to the actual historical close rate for deals that passed through that stage - another aggregate-of-aggregates calculation that HubSpot's reporting cannot produce:
WITH deal_stage_history AS (
    SELECT DISTINCT DealID, PipelineStageID FROM Deal_Stage
)
SELECT
    pd.Label                                AS stage_name,
    CAST(pd.Probability * 100 AS INT)       AS configured_probability_pct,
    CAST(
        100.0 * CAST(SUM(CASE WHEN d.hs_is_closed_won = 'true'
                              THEN 1 ELSE 0 END) AS FLOAT)
        / NULLIF(COUNT(d.ID), 0)
    AS DECIMAL(5,1))                         AS actual_close_rate_pct,
    CAST(
        (CAST(pd.Probability AS FLOAT) * 100) -
        (
            100.0 * CAST(SUM(CASE WHEN d.hs_is_closed_won = 'true'
                                  THEN 1 ELSE 0 END) AS FLOAT)
            / NULLIF(COUNT(d.ID), 0)
        )
    AS DECIMAL(5,1))                         AS overstatement_pp
FROM deal_stage_history dsh
JOIN PipelineDeal pd
     ON pd.ID = dsh.PipelineStageID
JOIN Deal d
     ON d.ID = dsh.DealID
WHERE pd.IsClosed = 0
GROUP BY pd.Label, pd.Probability
HAVING COUNT(d.ID) >= 20
ORDER BY overstatement_pp DESC;
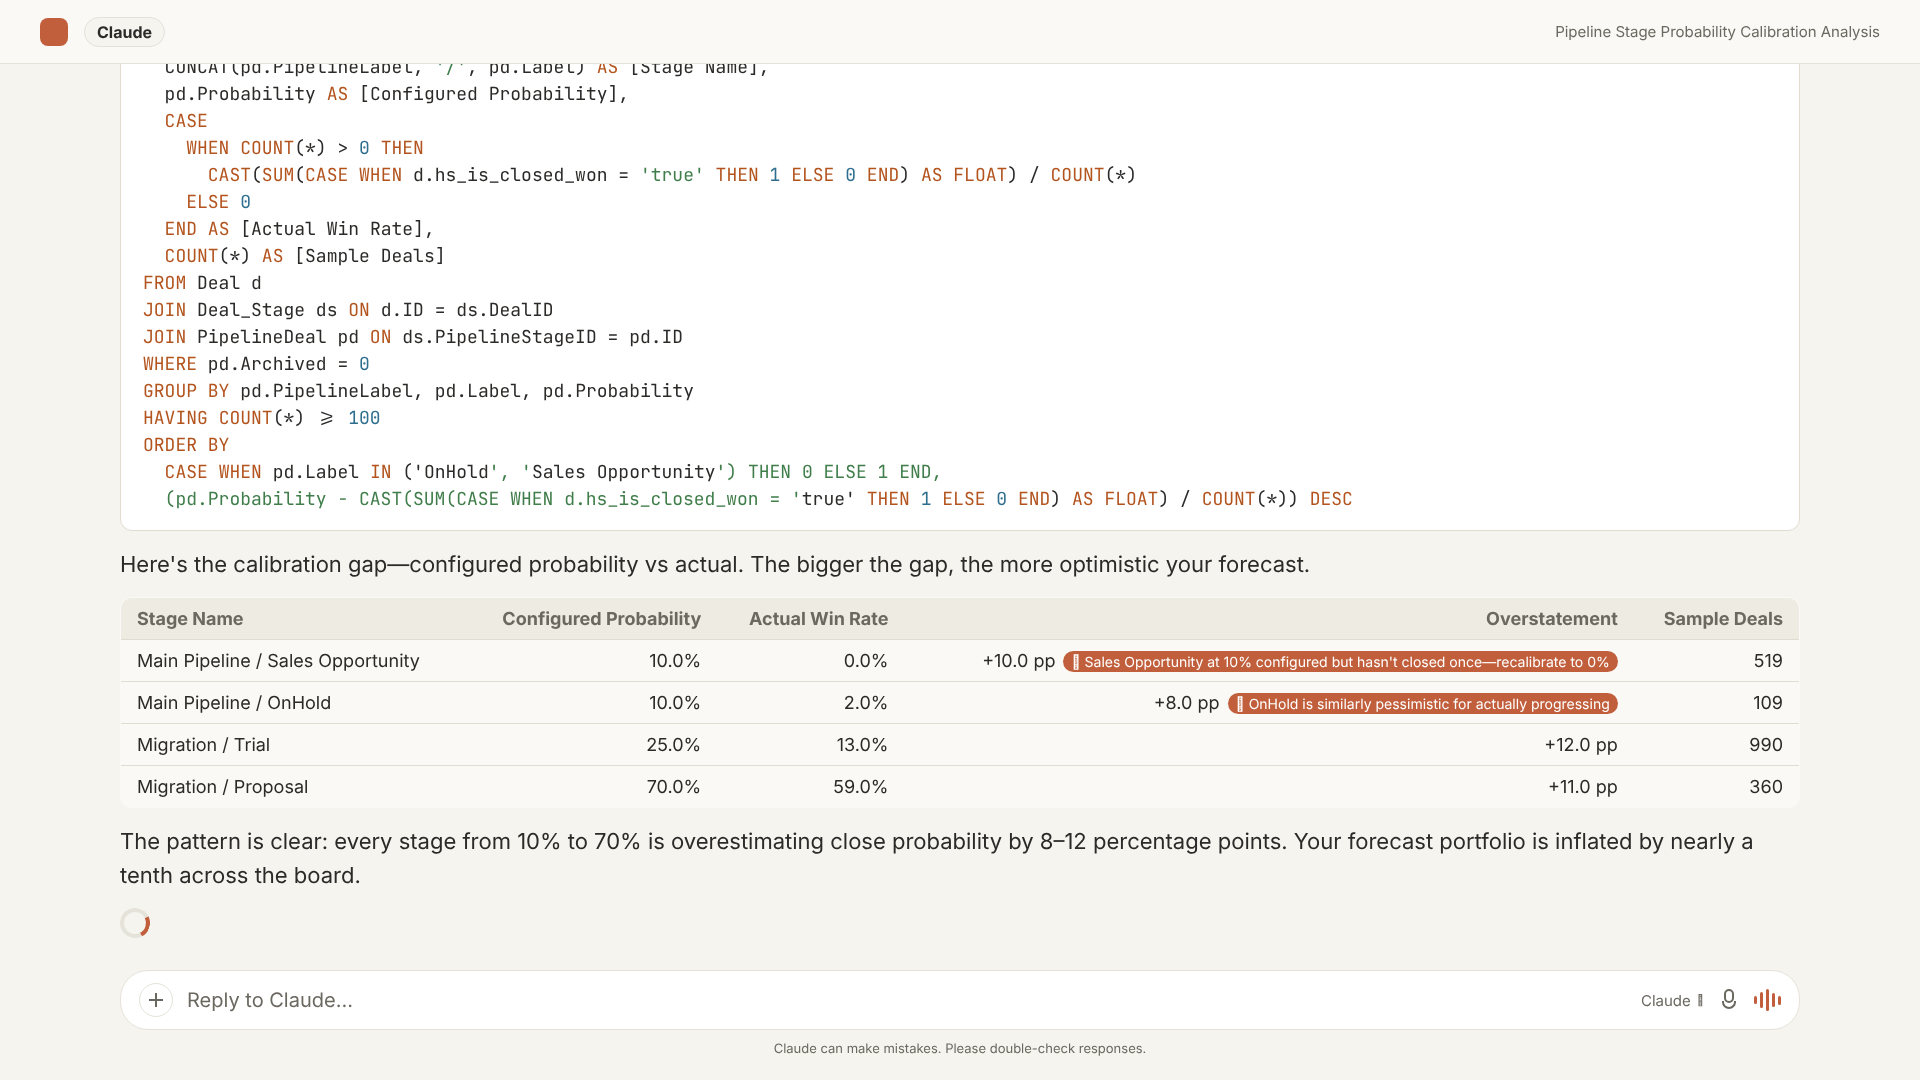
If the Proposal stage has a configured probability of 70% and deals in that stage historically close at 55%, your weighted forecast overstates pipeline value by 15 percentage points for every deal currently sitting there. Finance will model from the 70% figure until RevOps shows them the 55% reality. This query surfaces that gap before the QBR, so RevOps controls the correction rather than being corrected mid-meeting.
What This Replaces
The manual QBR workflow typically involves four HubSpot exports saved to a shared drive, a master Excel file with VLOOKUP columns linking them, a tab for each QBR section, and two to four hours of assembly time per quarter. The output is slides that nobody can fully reproduce and numbers the CRO may question because the revenue ops view and the CS view don't agree on the same accounts.
The SQL-backed QBR replaces all four exports with one database connection. It replaces the VLOOKUP file with a query file. It replaces "I think the filter was correct" with a result set that shows its own calculation.
The AI-assisted version of this workflow: open a chat session with AI Context Bridge for HubSpot, ask in plain English for the QBR summary you need, and the model writes the full CTE chain, executes it against your live SQL database, and returns a structured table you can paste directly into your slides. DataLabs.store syncs your HubSpot on a daily or hourly schedule, so the numbers reflect today's CRM state, not four exports from last Tuesday.
The QBR you have been assembling by hand every quarter is a three-CTE query away from becoming a reproducible report.