
HubSpot is excellent at tracking what happens in your sales process. The trouble starts when you need to understand why - and those explanations live at the intersection of multiple objects: deals filtered by the companies they belong to, contacts weighted by the emails they engaged with, reps scored by their own historical close rates applied to their current open pipeline.
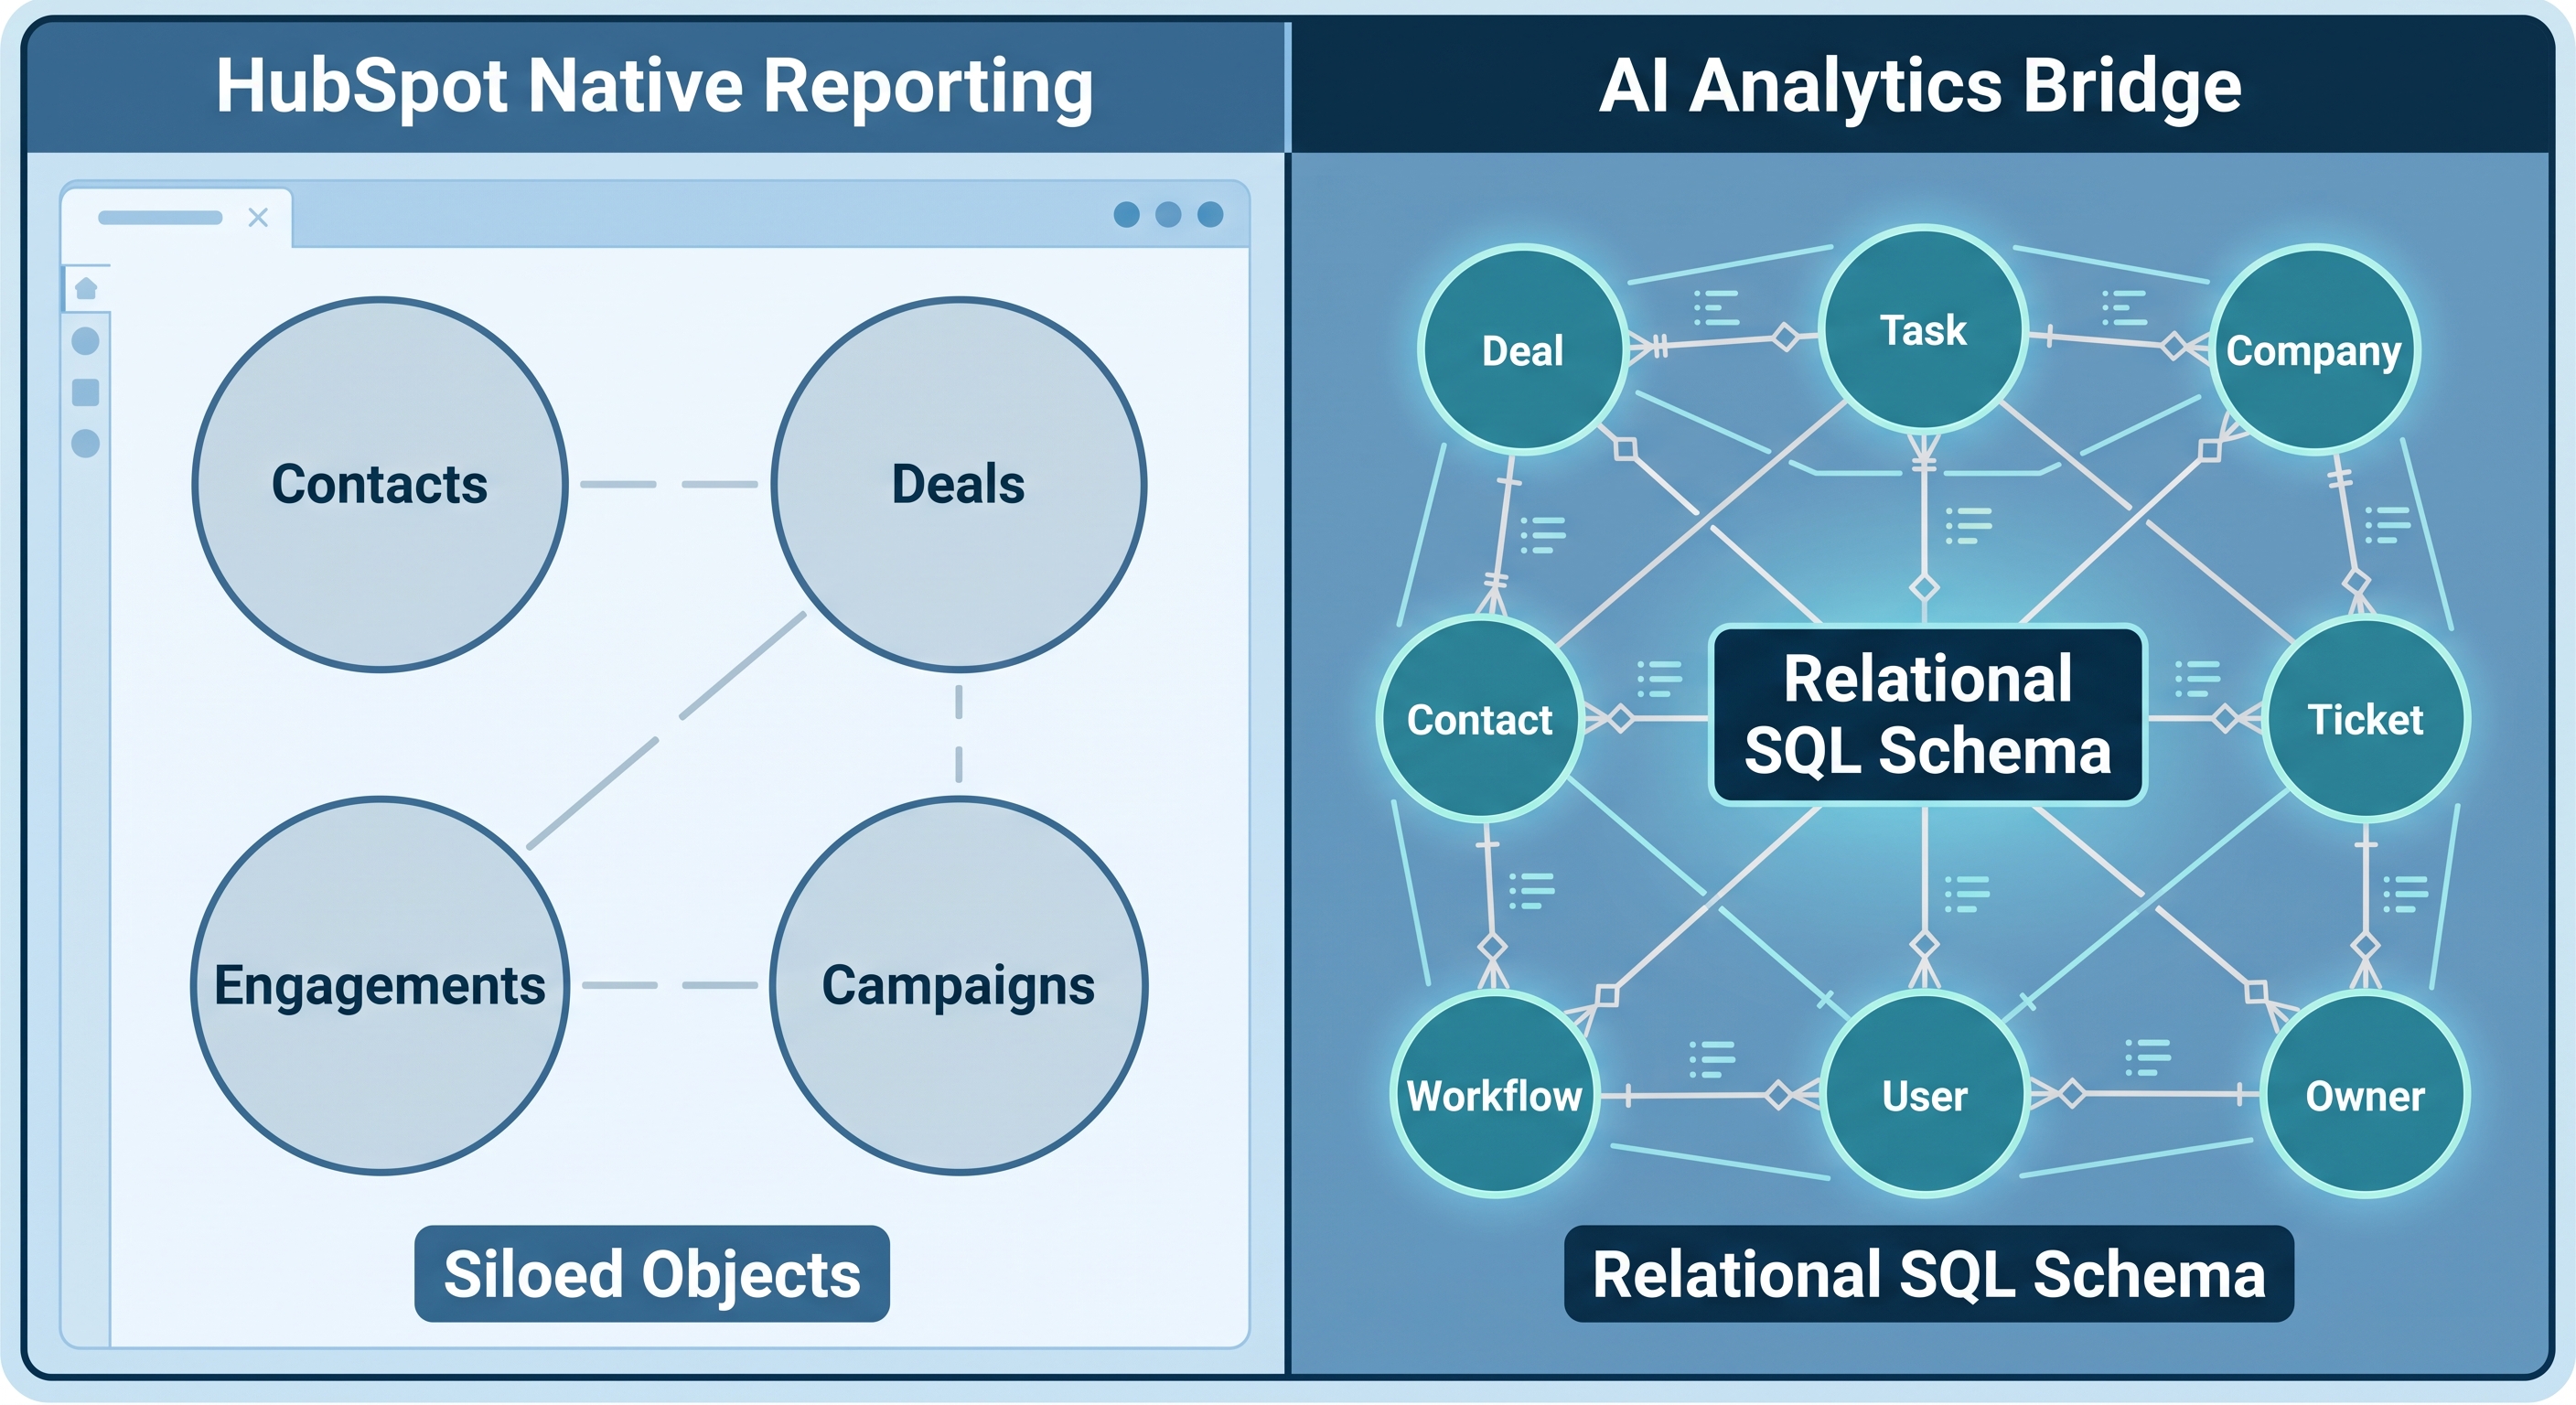
The moment a question crosses two or more object boundaries and requires a computed intermediate value, you are past what HubSpot's reporting engine was designed to handle. This is the core constraint behind HubSpot association limits: the reporting layer was built for property-based lookups across adjacent objects, not for traversing a relational graph.
This post explains what that structural limit actually is, which questions hit it first, and how a SQL layer built on top of your HubSpot data removes it.
The Architecture Underneath HubSpot Reports
HubSpot's CRM is built around discrete objects: Contacts, Companies, Deals, Tickets, and custom objects for higher-tier accounts. Associations connect them: a Contact is associated with a Company, a Deal is associated with a Contact, and so on.
The reporting engine was designed around this object-centric model. When you build a report in HubSpot's custom report builder, you choose a primary object and can pull in properties from associated objects via lookup. What the engine cannot do is treat those associations as a relational graph, traverse multiple hops simultaneously, or compute a derived value in one part of the query and use it as an input to another.
This is an architectural tradeoff, not a product defect. HubSpot's reporting covers the vast majority of questions most teams ask day-to-day. The problem is the remainder: questions that appear regularly in QBRs and pipeline reviews, and that require relational logic the engine was never built to express.
Three Limits That Block Real Revenue Analysis
Association Depth: Two Hops Maximum
HubSpot's Enterprise custom report builder supports cross-object reporting, but association traversal depth is limited. In practice, you can link a primary object to one adjacent object type: deals to companies to pull in industry, contacts to companies to pull in region. You cannot traverse three objects in sequence within a single report.
The practical consequence: email-to-deal attribution is off the table. Connecting a marketing email engagement event to the contact who opened it, and then to the deal that contact eventually became, requires three object hops. HubSpot's reporting UI has no path through all three. Most teams answer this with an Excel export and a VLOOKUP.
No Computed Aggregates in Filters
SQL's HAVING clause lets you filter on values computed at query time: HAVING AVG(amount) > 25000 returns only the groups where average deal size clears a threshold. HubSpot's custom report builder has no equivalent. You can segment records by stored property values, but not by aggregated values derived during the report itself.
This blocks rep performance filtering directly in the tool. "Show me only account executives who closed at least five deals with an average size above $50,000 last quarter" is a single GROUP BY with a HAVING clause in SQL. In HubSpot, it requires an export and manual filtering.
Aggregate of Aggregates
This is where forecast calibration breaks down entirely. A typical example: "What is the win rate across the enterprise team, weighted by each rep's deal volume?" Answering it correctly requires computing win rate per rep - that is one aggregate - then multiplying each rate by that rep's deal count to produce a weighted contribution, and finally summing and dividing across reps. That is an aggregate of the first aggregates. HubSpot has no mechanism for this two-pass logic. You compute it in Excel or you do not compute it at all.
Questions Your Team Is Currently Answering in Excel
Three questions that appear regularly in pipeline conversations - and that HubSpot's custom report builder cannot answer in a single report:
Win-rate-weighted pipeline by rep. "Show each rep's open pipeline, weighted by their own historical close rate over the past 12 months." This is the most common ask in any serious forecast calibration exercise. It requires computing close rate per rep from historical closed deals (one aggregate), then applying that rate as a multiplier to current open pipeline amounts (a second pass). The result surfaces which reps have credible pipeline versus inflated headline numbers. HubSpot shows raw pipeline totals. Weighted pipeline requires a CTE.
Stage-rot detection. "Which deals have been in their current stage for more than 21 days with no activity logged?" HubSpot tracks both stage entry dates and last-activity timestamps as deal properties. What it cannot do is compute the difference between those two values and filter on the result within the report builder. You can build a workflow to stamp a custom field when a deal ages past a threshold. But that means maintaining a workflow rather than asking a question.
Email campaign to deal attribution. "For each email campaign, what share of contacts who opened became a deal within 90 days?" This requires connecting three object types: marketing email engagement events, contacts, and deals - with a time window on the deal create date. It is standard attribution analysis for any team using HubSpot Marketing alongside the CRM. The cross-object path does not exist in HubSpot reporting. It requires a spreadsheet merge each time someone asks.
How AI Context Bridge Fills the Gap
AI Context Bridge for HubSpot works in three stages.
Stage 1: Sync to SQL Server. Your HubSpot data - contacts, companies, deals, engagement events, owners, pipelines, and their associations - is synced via OAuth into a real Microsoft SQL Server database. The result is a normalized relational schema with proper foreign keys. Not a flat export. Not a JSON blob. Each object type gets its own table; associations are stored as join tables with foreign key relationships between them.

Stage 2: MCP endpoint. A Model Context Protocol (MCP) endpoint exposes the SQL Server database to Claude or ChatGPT. The AI knows the schema - which tables exist, which columns they contain, how tables link - and can write SQL against it in response to plain-English questions.
Stage 3: Plain English to real SQL. You ask a question. The AI writes a T-SQL query, executes it against your actual HubSpot data, and returns both the result and the query. The query is visible and readable. Your finance or data team can inspect it, copy it, and run it independently.
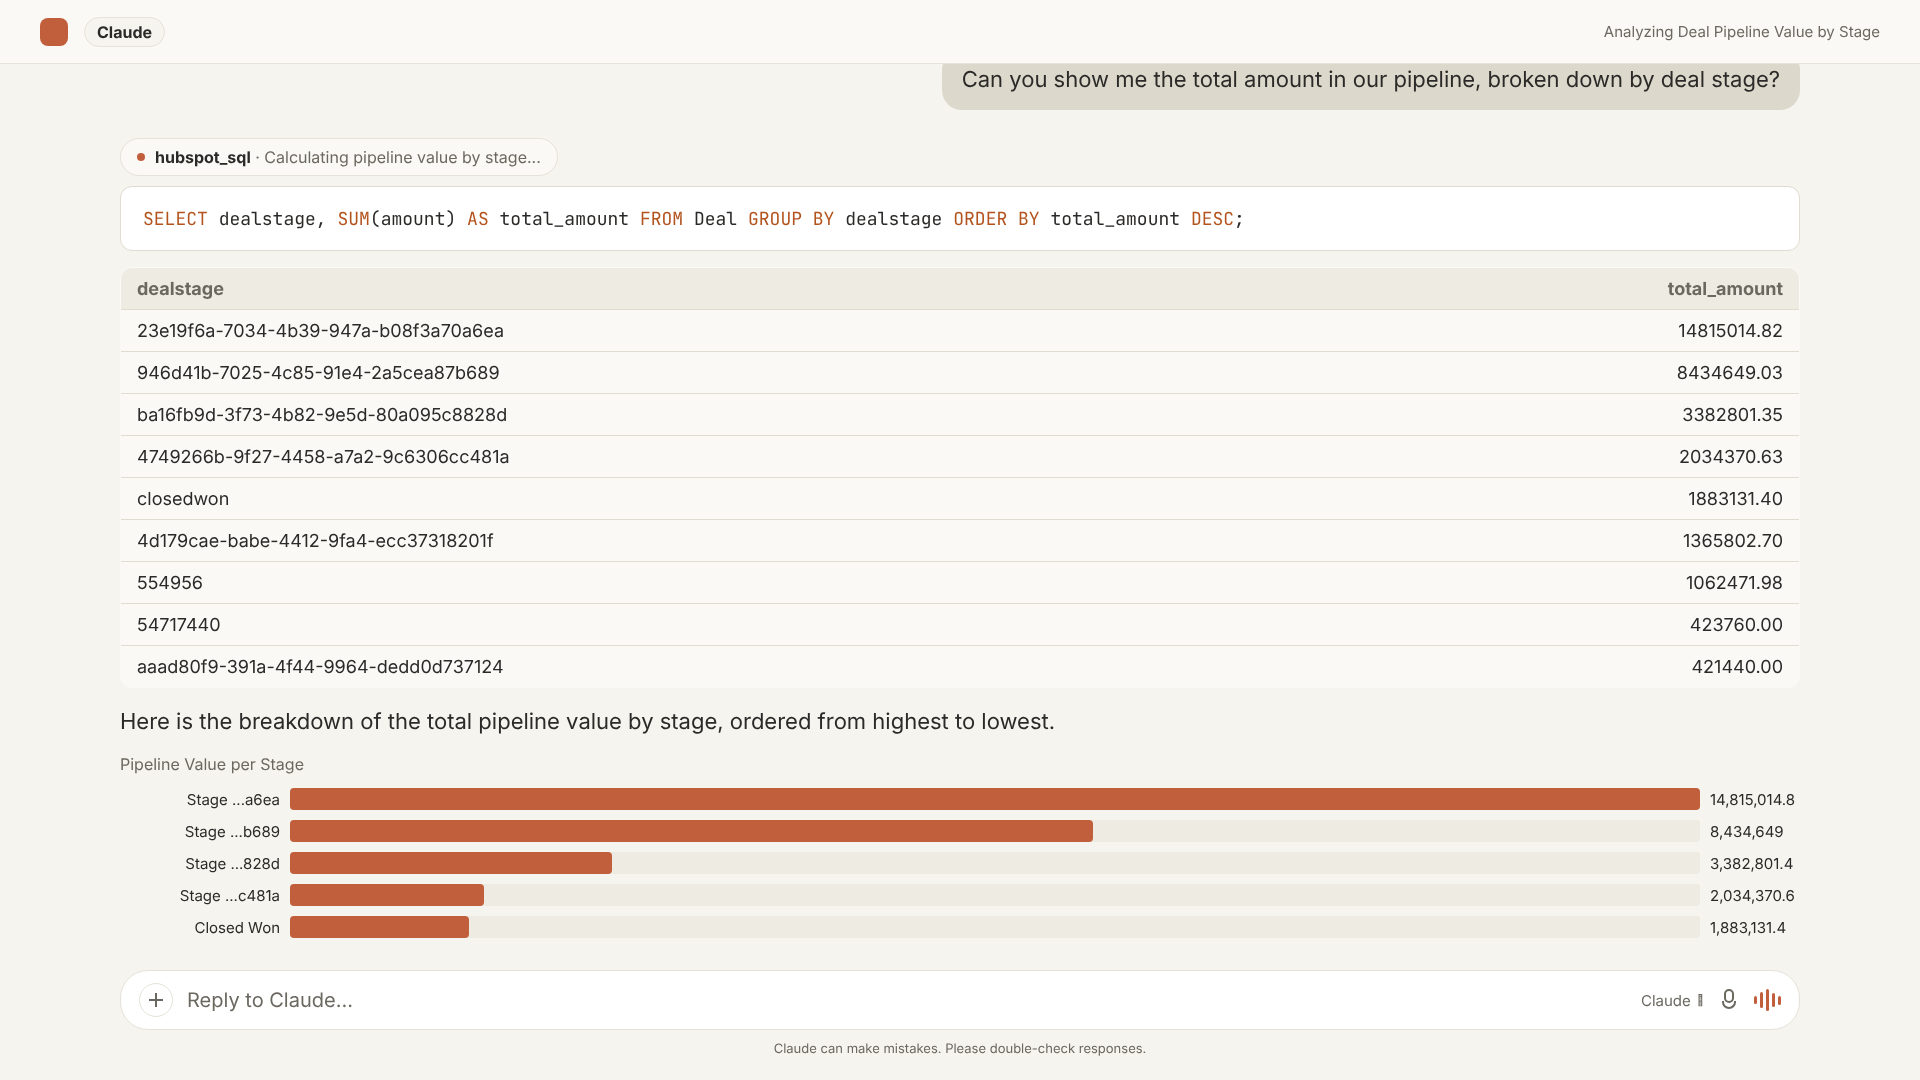
The example above joins deal records to company records on the association foreign key, uses DATEDIFF to compute days from deal creation to close, and groups results by quarter and company industry. This is a JOIN across two HubSpot object types with a calculated column and a two-dimension GROUP BY - not possible in HubSpot's report builder, answered in under a second via the SQL layer.
Multi-Level Joins in Practice: Email Attribution
Email-to-deal attribution shows three-level SQL traversal in a concrete, familiar context.
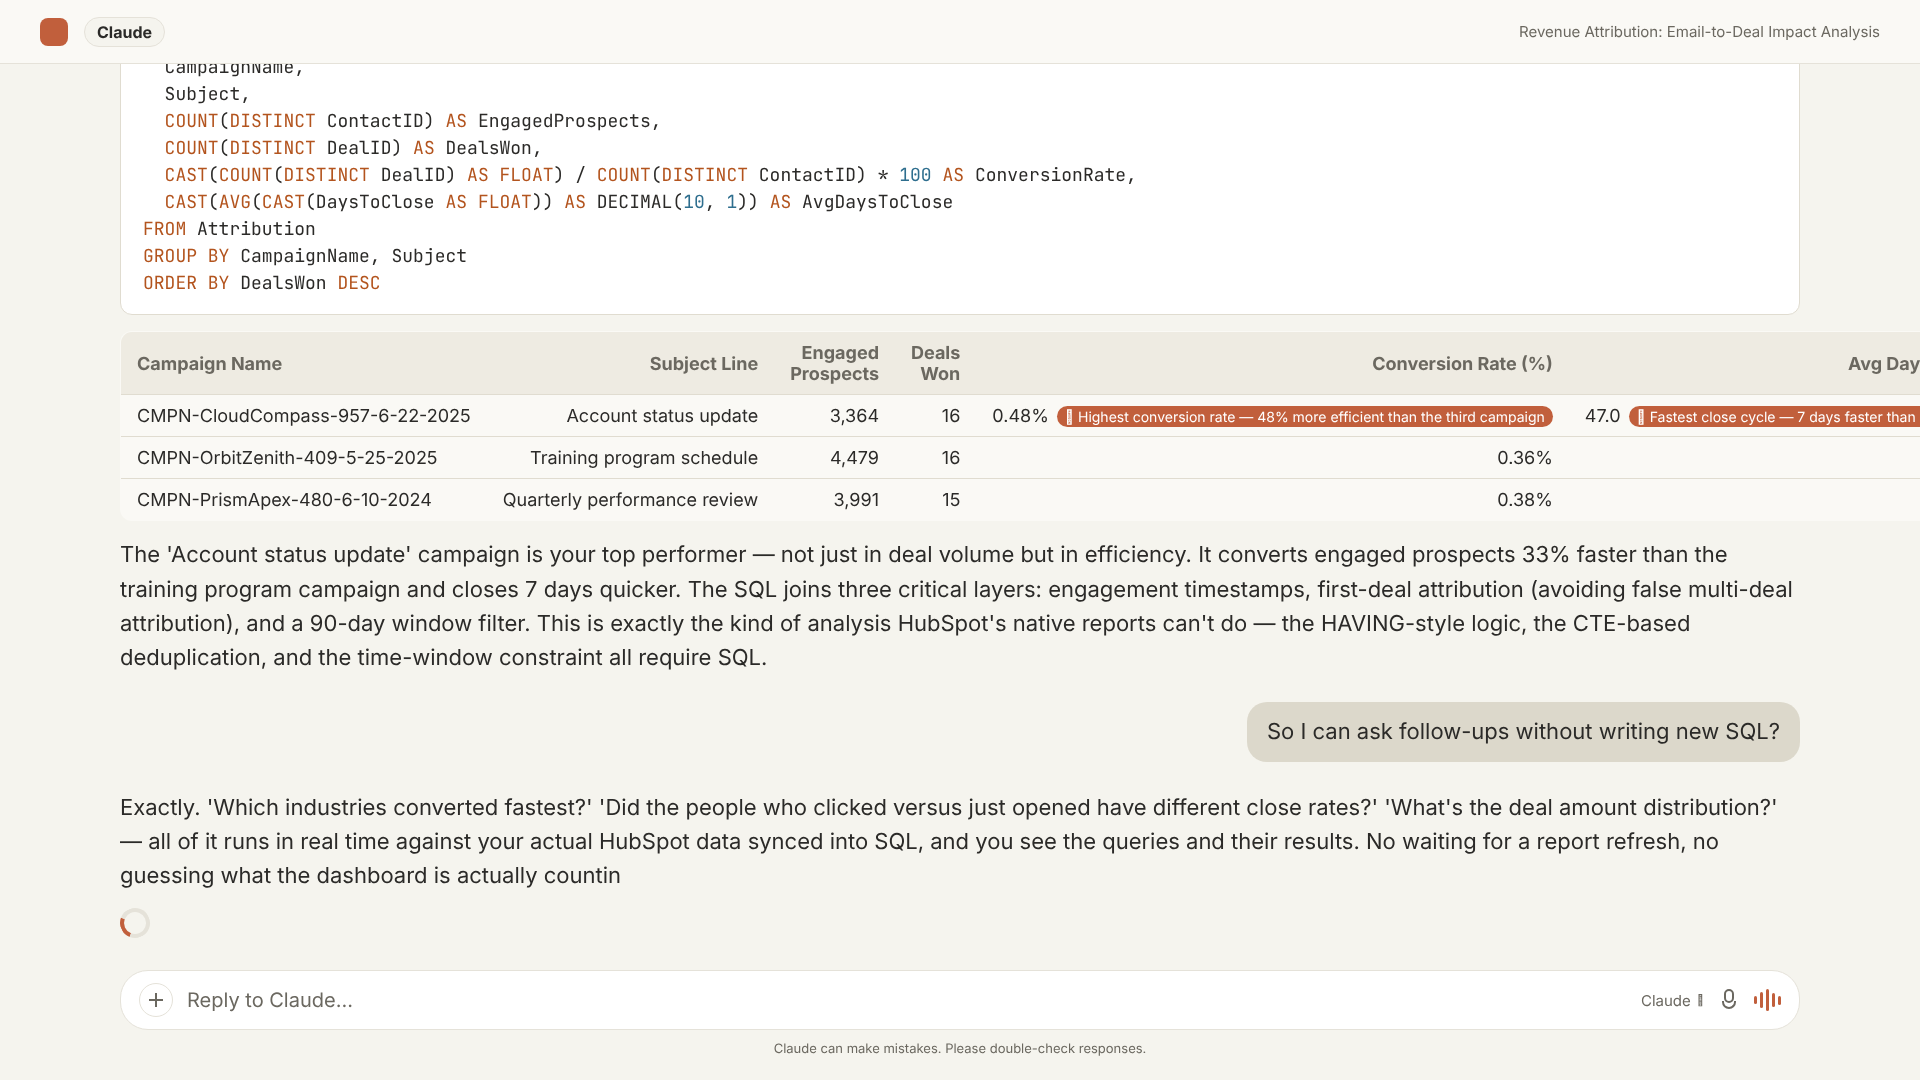
The query uses a CTE to isolate the first engagement event per contact - the earliest email open record per contact ID - then joins that derived result to deals where the deal create date falls within 90 days of the engagement. The final output shows, per campaign: contacts engaged, contacts who became deals, conversion rate, and average days from first email open to deal creation.
This is roughly 20 lines of SQL. It uses one CTE, one JOIN across three object types, and one time-windowed filter. It is not sophisticated by SQL standards. It is impossible by HubSpot reporting standards, because the reporting engine has no path from an email engagement event to a downstream deal.
The difference is not the AI. The AI is the plain-English interface. The difference is the relational database underneath, where those three object types are three joined tables with proper foreign keys connecting them.
The Right Tool for the Right Layer
HubSpot is excellent at what it was designed to do: tracking relationships between records, logging activity, and running property-based segmentation. Its reporting layer was optimized for those use cases and handles them well.
The gap is not a defect. It is a structural consequence of building a reporting engine around object properties and association lookups rather than relational joins. When your questions require a JOIN, a CTE, a window function, or an aggregate of aggregates - and those questions do appear regularly in pipeline reviews and QBRs. You have outgrown what HubSpot SQL reporting provides natively.
DataLabs.store AI Context Bridge adds the relational SQL layer your HubSpot data deserves. Your CRM records become real database tables with proper foreign keys, and every question your team has been answering in Excel becomes something you can ask in plain English and get back in seconds - with the underlying query shown, auditable, and reusable.