
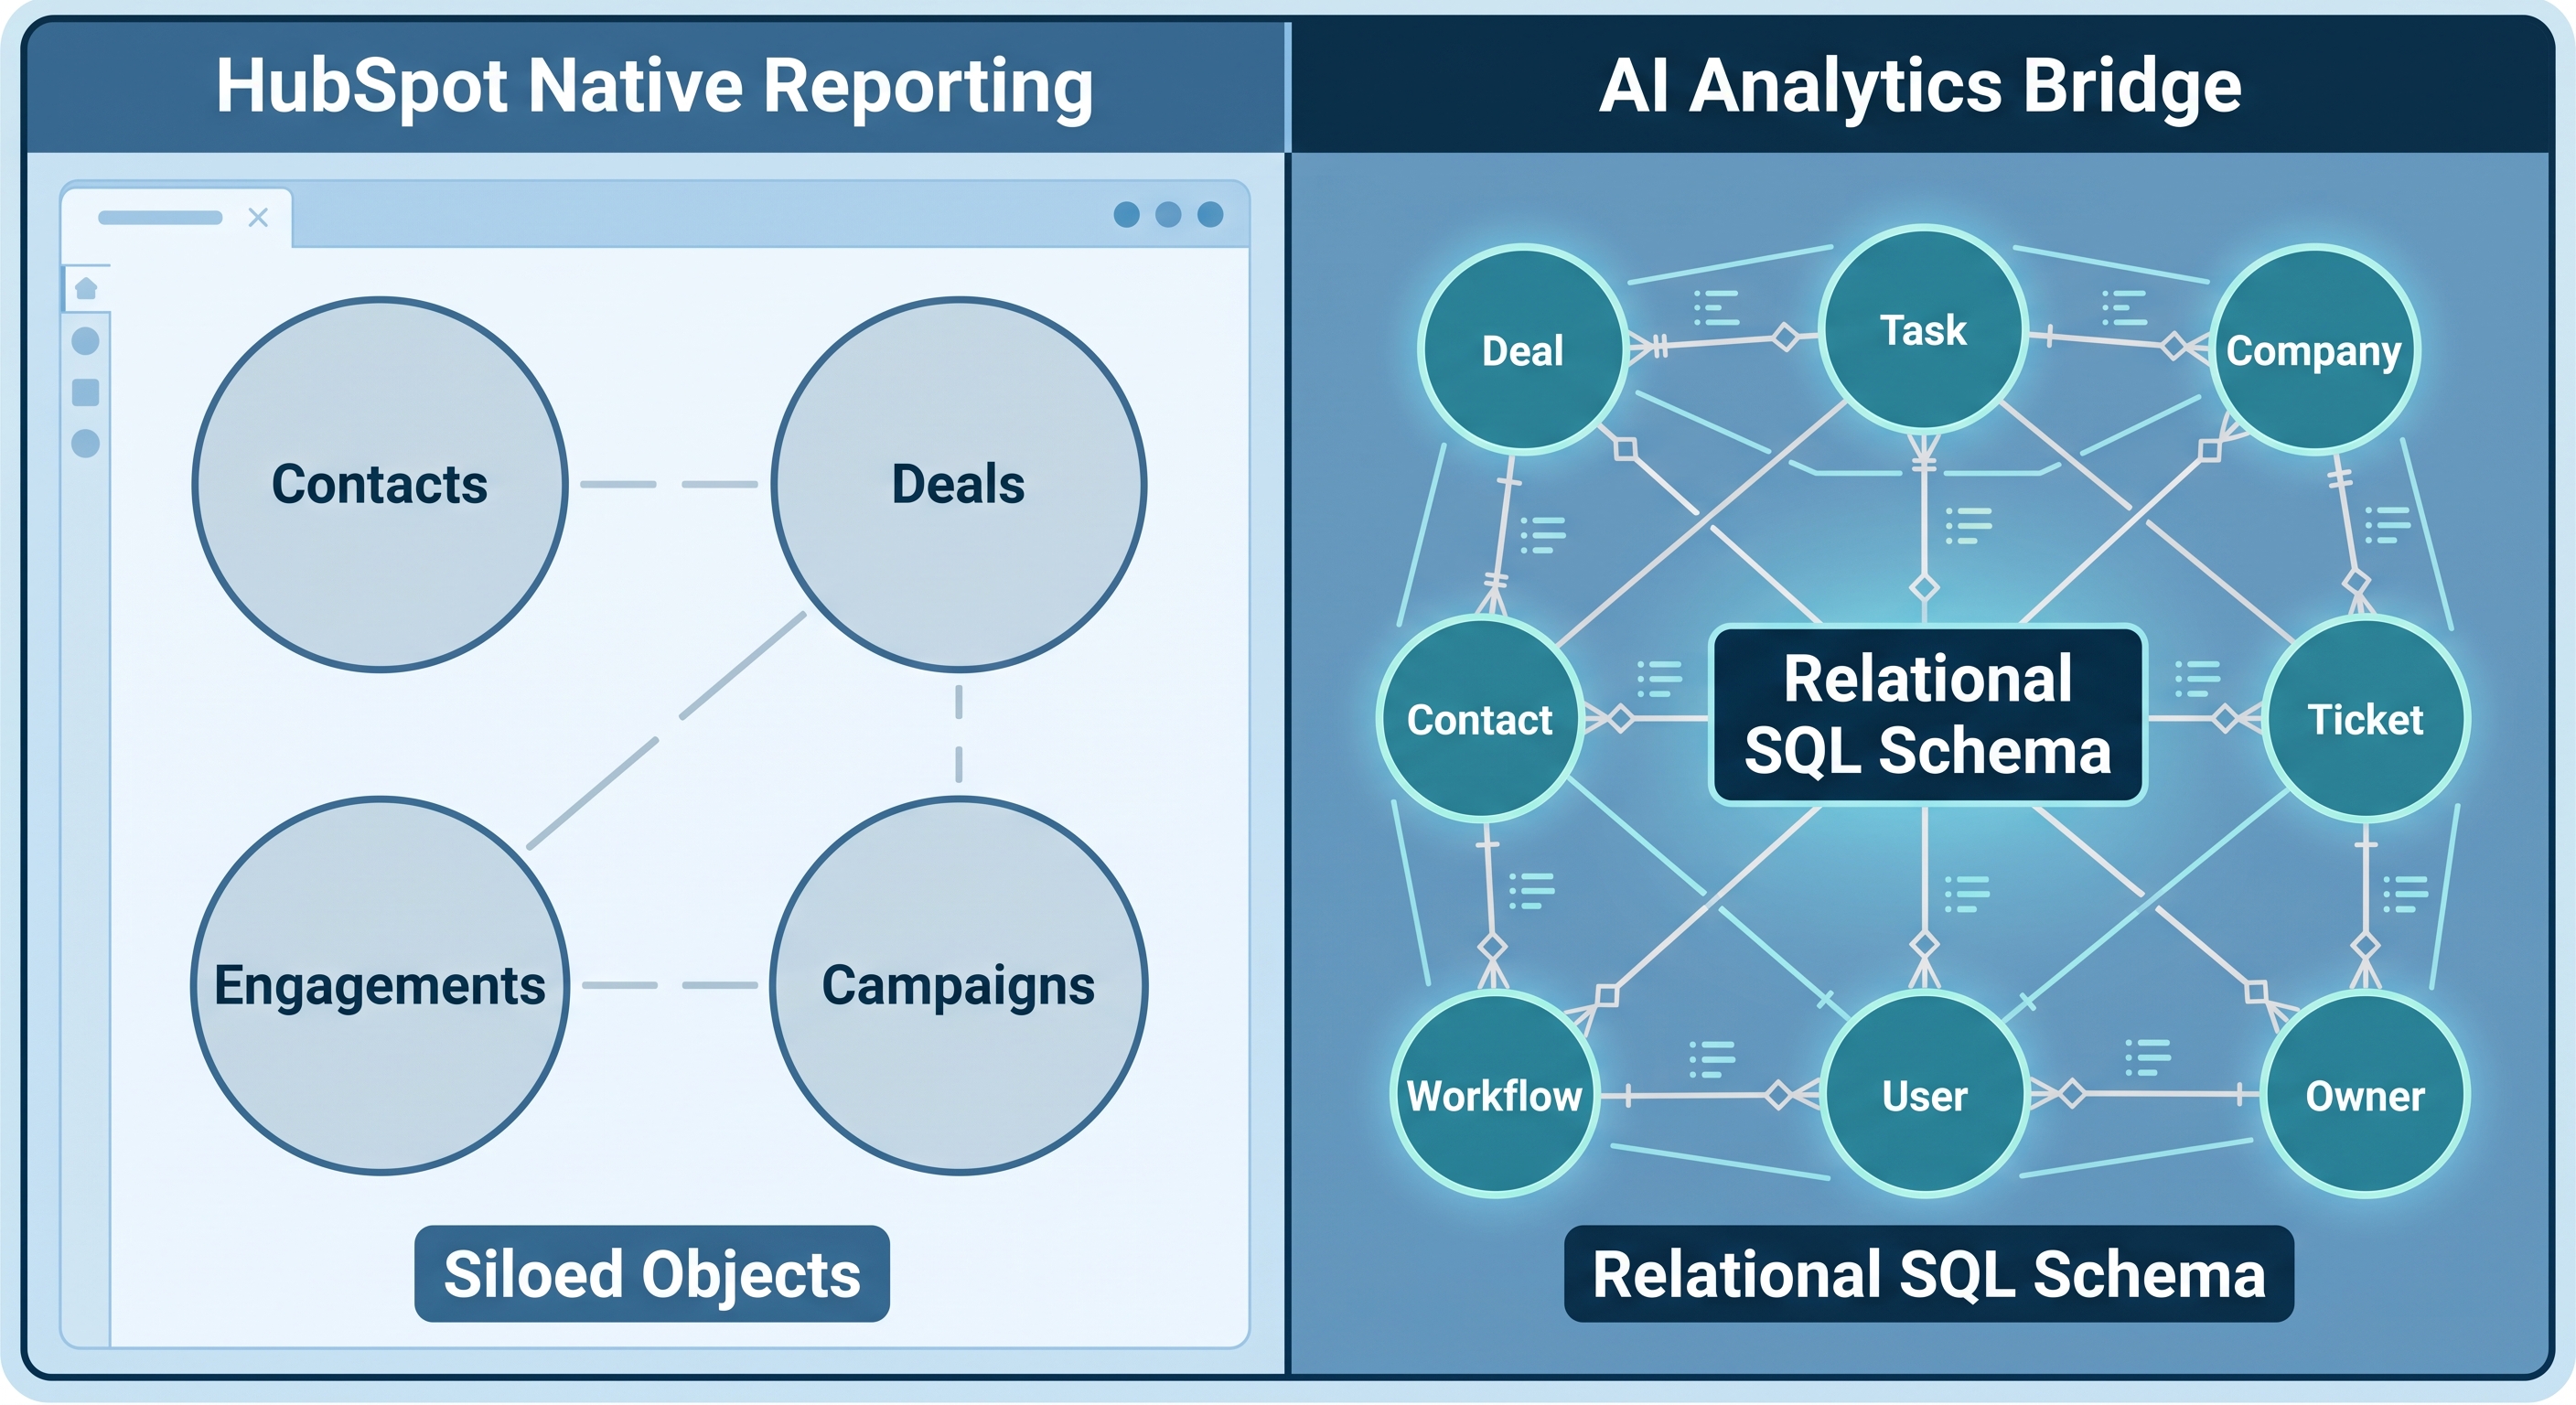
HubSpot's reporting keeps improving. But underneath the interface updates, there is a structural constraint that no plan tier removes: every native report is anchored to a single primary object, and the chain of associated objects you can traverse from it has firm limits.
When your questions stay within that chain, HubSpot works well. When they require crossing more object types than the report builder can hold, you reach a dead end. This post explains exactly where that limit sits, why it is architectural rather than accidental, and how a SQL-based approach bypasses it entirely.
What the Association Limit Actually Means
HubSpot's standard Report Builder lets you pick a primary object - Deals, Contacts, Companies, and so on - and surface properties from objects directly associated with it. A Deals report can pull in Company industry, Contact owner, and deal stage without issue.
The Enterprise Custom Report Builder adds cross-object reach: you can pull properties from associated records and build reports that touch more than one object type. That covers a lot of standard use cases.
It does not cover questions that require SQL-style JOIN logic: multi-step aggregations, conditions applied mid-chain, or analysis that draws on three or more object types in a single calculation. HubSpot's report builder has no concept of a CTE (Common Table Expression), no window functions (RANK, SUM OVER, LAG), and no support for aggregate-of-aggregates. The classic example of the last one: computing each rep's individual win rate and then averaging those rates across reps requires computing a ratio per rep before averaging across reps: a two-step aggregation that the native report layer cannot express in one operation.
The moment a question needs that kind of relational logic, native reporting has no path forward. There is no configuration or tier upgrade that adds these capabilities to HubSpot's report layer.
Three Questions That Hit the Association Wall
Here are three questions RevOps and finance teams encounter regularly. Each looks like a standard CRM question. Each fails in HubSpot's native reporting for the same structural reason.
Win rate and average deal size by sales territory. If territory is a custom object associated with Contacts, and Deals are associated with those Contacts, the query needs: Deals → Contacts → Territories. Three object types. The Custom Report Builder cannot produce a single computed metric - win rate - from a JOIN chain of that depth with a GROUP BY on the third object.
Which email campaigns drove the most deals, and how long after first engagement? This chains: Email Campaign Events → Contacts → Deals. Three object types, and it requires a sub-aggregation to establish each contact's first engagement date before computing time-to-deal at the campaign level. HubSpot has no equivalent of a CTE: the intermediate result set that makes this sequence of logic possible in a single pass.
Which marketing-sourced contacts have the highest close rate, broken down by sales rep? This spans: Contacts filtered by original source → Contact-Deal Associations → Deals → Deal Owners. Close rate is a ratio of two separate counts, making it an aggregate-of-aggregates. HubSpot can return won deals per rep and total deals per rep as separate numbers, but it cannot divide one by the other within the same report to produce a percentage column.
Why a Higher Tier Does Not Fix This
It is worth being direct about this, because HubSpot's tier descriptions can make the situation look like a plan-level feature gap. The Enterprise Custom Report Builder does add meaningful depth. It unlocks cross-object reach that Professional does not have. But the structural constraints described above persist at every tier.
No HubSpot plan adds SQL-style JOINs with conditions, window functions, CTEs, or aggregate-of-aggregates to the report builder. These are absent by design. HubSpot's data layer is built for operational speed and schema flexibility, not for the multi-step relational logic that analytics requires. Both design choices are defensible for their respective use cases; they simply do not coexist in a single report-building tool.
Any team that needs multi-object analytics from HubSpot data needs to move that data into a system built for relational queries and ask their questions there.
How AI Context Bridge Solves This
AI Context Bridge for HubSpot takes exactly that approach. It syncs your HubSpot data - contacts, companies, deals, activities, email events, custom objects, and all association tables - into a real Microsoft SQL Server database via OAuth. Every HubSpot association becomes a foreign-key relationship in that database. The result is a normalized relational schema with no association-depth limit and no restriction on how many tables a single query can join.
DataLabs.store then exposes that schema to Claude or ChatGPT through an MCP (Model Context Protocol) endpoint. You ask a question in plain English; the AI writes the T-SQL, runs it against your synchronized HubSpot data, and returns the result alongside the full query so you can audit every step of the logic.

The sync runs on a configurable schedule - daily on the entry tier, hourly on higher plans - so the database reflects current HubSpot state without a manual export step.
The Queries That Now Work
Territory-Level Win Rate
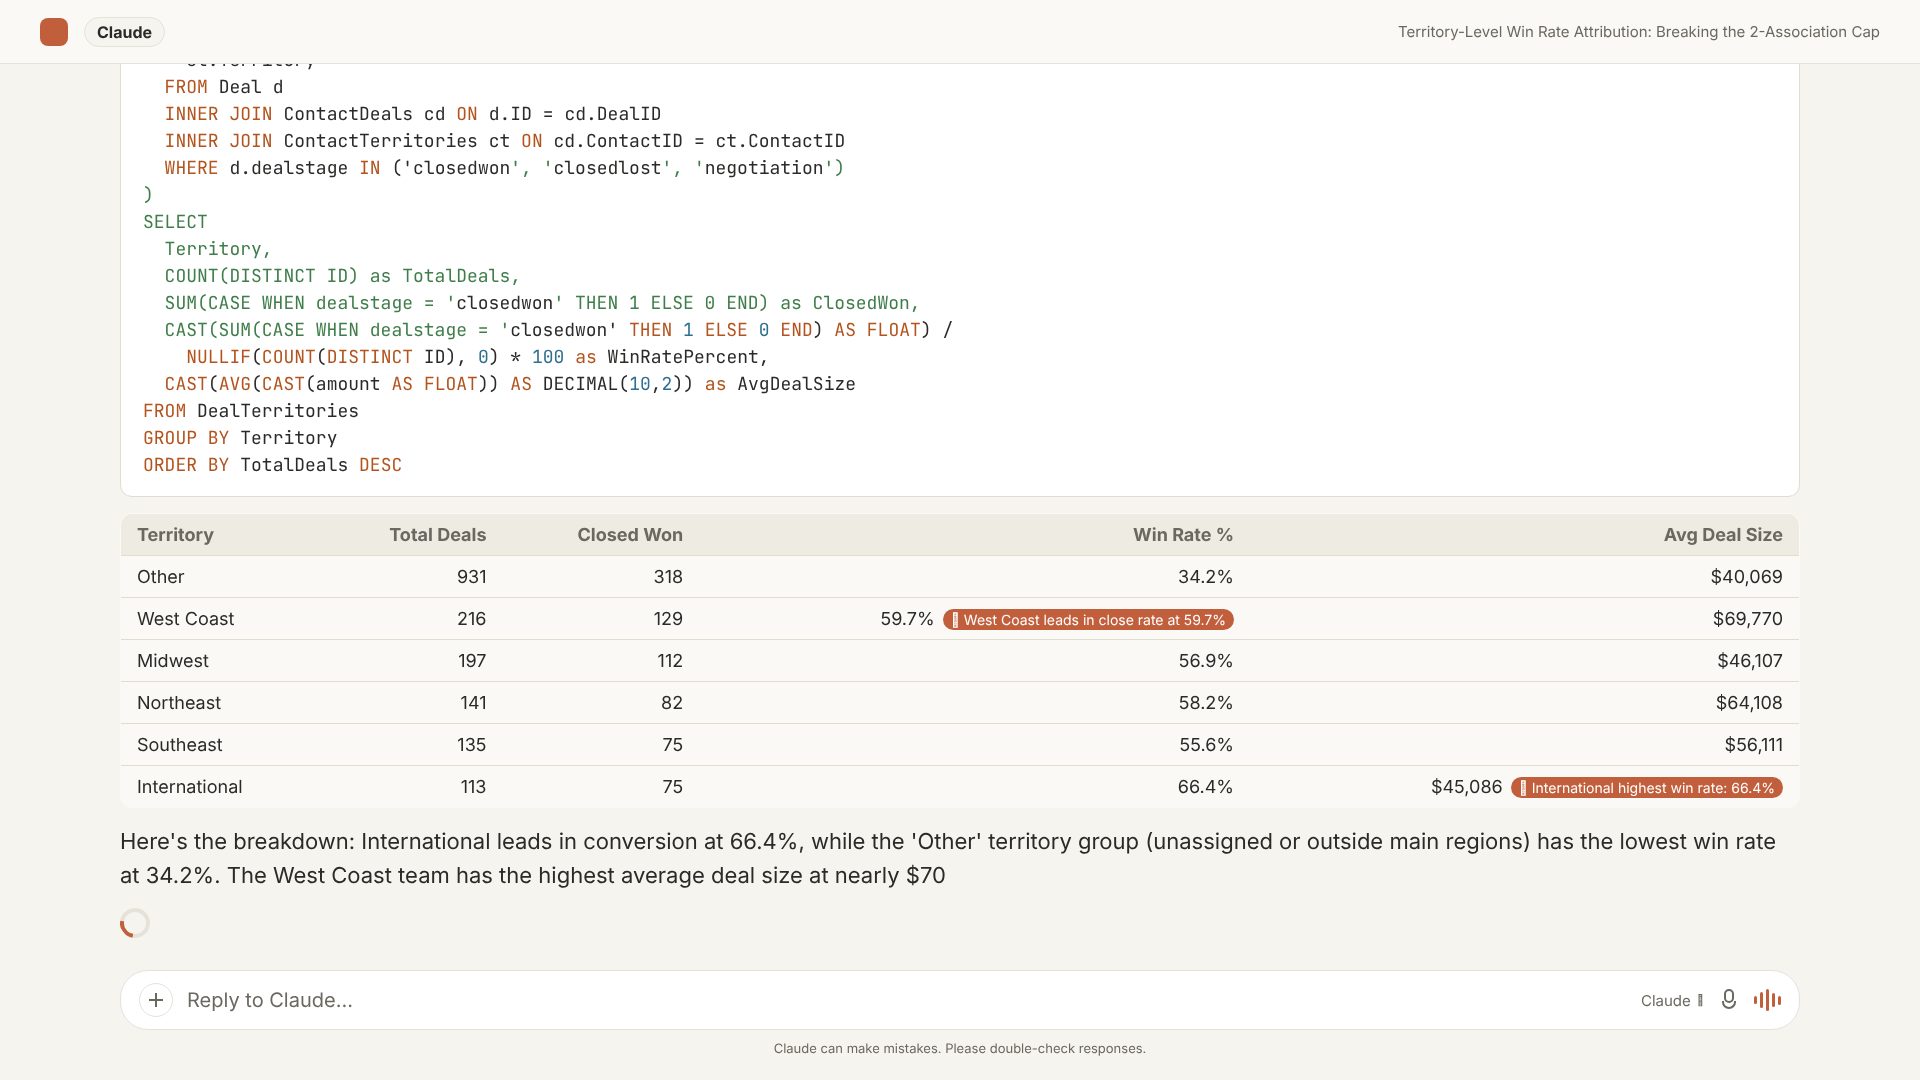
The query below answers "What is our win rate and average deal size by sales territory?" - a five-table JOIN that is structurally impossible in HubSpot's native report builder:
SELECT
    t.territory_name        AS Territory,
    COUNT(d.dealid)         AS TotalDeals,
    SUM(CASE WHEN d.dealstage = 'closedwon' THEN 1 ELSE 0 END)
                            AS ClosedWon,
    ROUND(
        100.0 * SUM(CASE WHEN d.dealstage = 'closedwon' THEN 1 ELSE 0 END)
            / NULLIF(COUNT(d.dealid), 0),
        1
    )                       AS WinRatePct,
    AVG(d.amount)           AS AvgDealSize
FROM hs_deals d
JOIN hs_deal_contact_associations dca
    ON d.dealid = dca.dealid
JOIN hs_contacts c
    ON dca.contactid = c.contactid
JOIN hs_contact_territory_associations cta
    ON c.contactid = cta.contactid
JOIN hs_territories t
    ON cta.territoryid = t.territoryid
GROUP BY t.territory_name
ORDER BY WinRatePct DESC;
The JOIN chain - Deals, Deal-Contact Associations, Contacts, Contact-Territory Associations, Territories - is five tables deep. HubSpot's report builder has no mechanism to traverse that path and compute a ratio from the end of it. SQL does it in one pass, and the query is reproducible on demand with fresh data on each run.
Email Campaign Attribution with First-Touch Logic
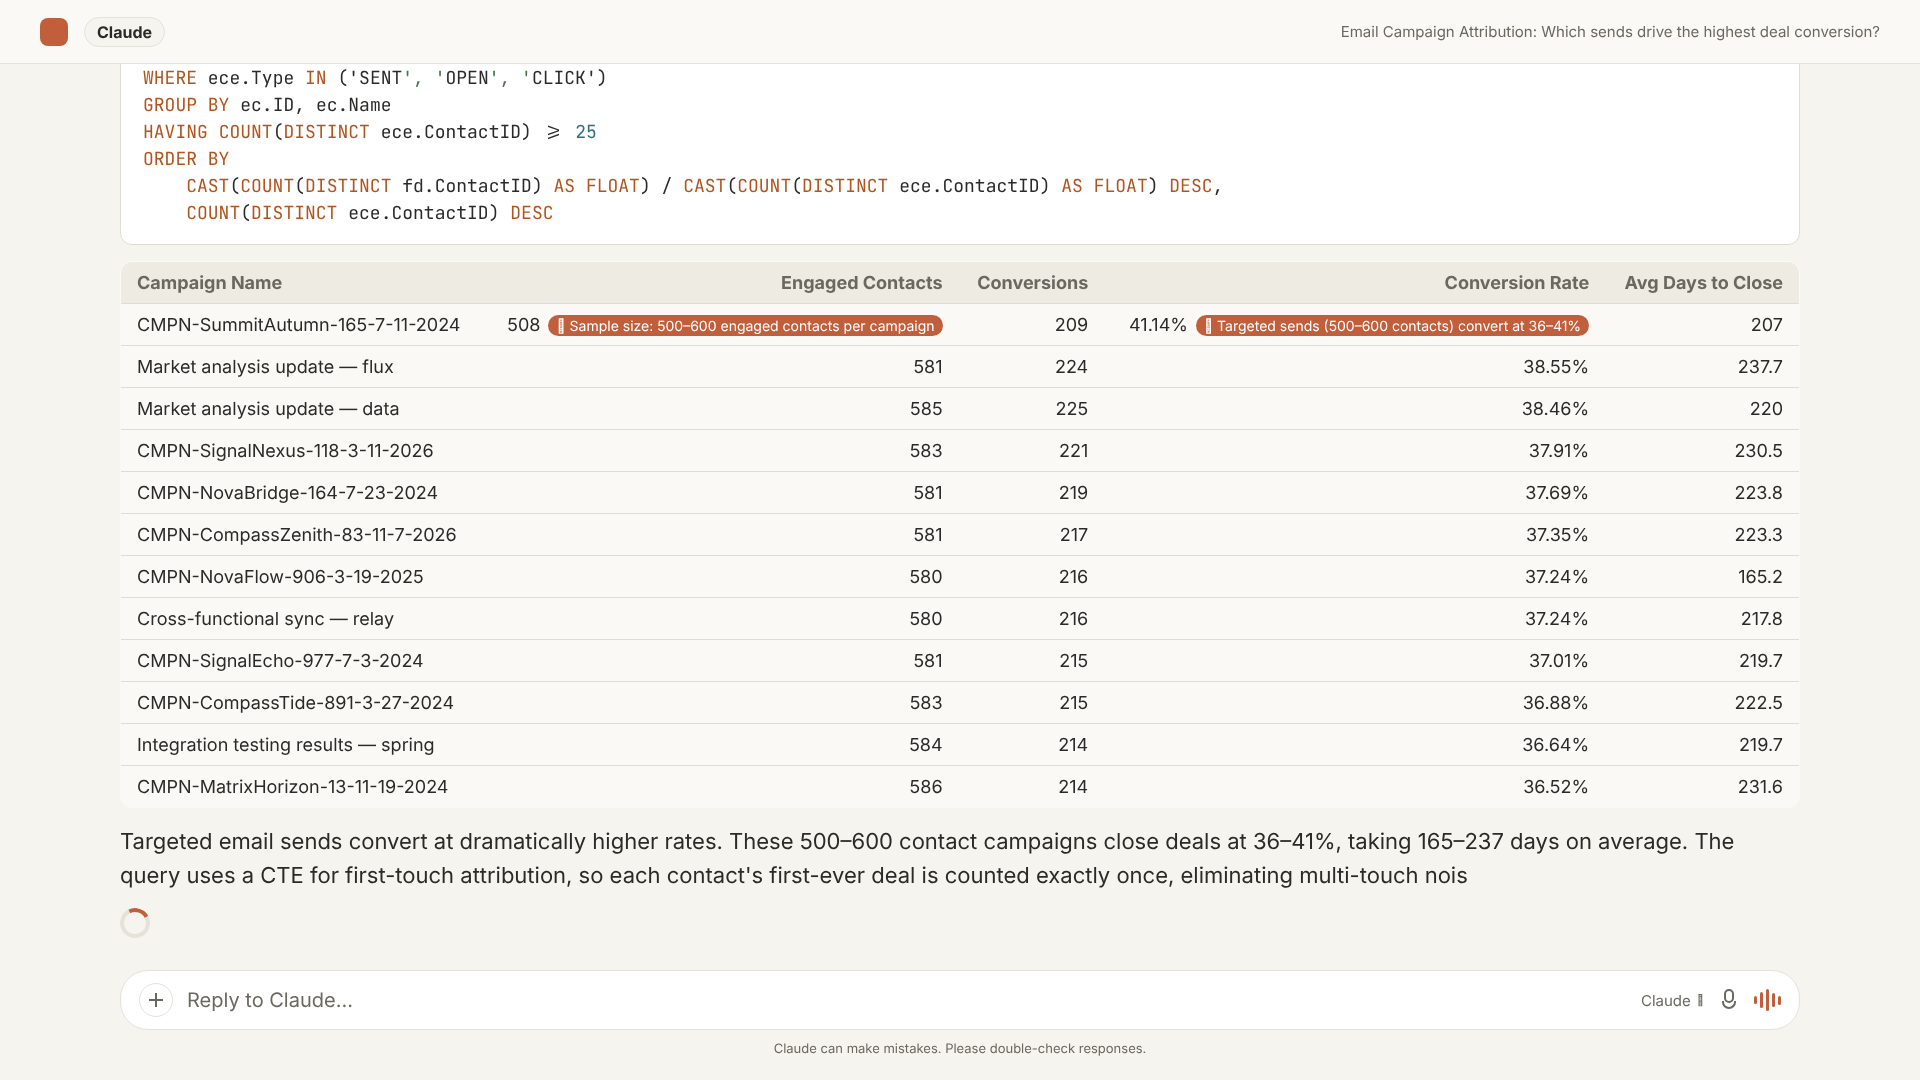
This query identifies which email campaigns produced the most deals and measures how long contacts took to convert after first engagement. A CTE establishes first-touch attribution per contact before the main query computes campaign-level metrics: intermediate logic that has no native equivalent in HubSpot:
WITH FirstTouch AS (
    SELECT
        e.contactid,
        e.campaign_id,
        MIN(e.event_timestamp) AS first_engagement
    FROM hs_email_campaign_events e
    WHERE e.event_type IN ('OPEN', 'CLICK')
    GROUP BY e.contactid, e.campaign_id
)
SELECT
    ec.campaign_name,
    COUNT(DISTINCT ft.contactid)                                    AS EngagedContacts,
    ROUND(
        100.0 * COUNT(DISTINCT d.dealid)
            / NULLIF(COUNT(DISTINCT ft.contactid), 0),
        1
    )                                                               AS ConversionRate,
    AVG(DATEDIFF(day, ft.first_engagement, d.createdate))           AS AvgDaysToFirstDeal
FROM FirstTouch ft
JOIN hs_contacts con
    ON ft.contactid = con.contactid
JOIN hs_contact_deal_associations cda
    ON con.contactid = cda.contactid
JOIN hs_deals d
    ON cda.dealid = d.dealid
JOIN hs_email_campaigns ec
    ON ft.campaign_id = ec.campaignid
GROUP BY ec.campaign_id, ec.campaign_name
HAVING COUNT(DISTINCT ft.contactid) >= 25
ORDER BY ConversionRate DESC;
The HAVING clause enforces a minimum sample floor: only campaigns with at least 25 engaged contacts appear in the results. That kind of inline quality filter keeps low-volume outliers from dominating the ranking. It is straightforward SQL and completely outside what HubSpot's native attribution tools support.
Marketing-Sourced Deals by Sales Rep
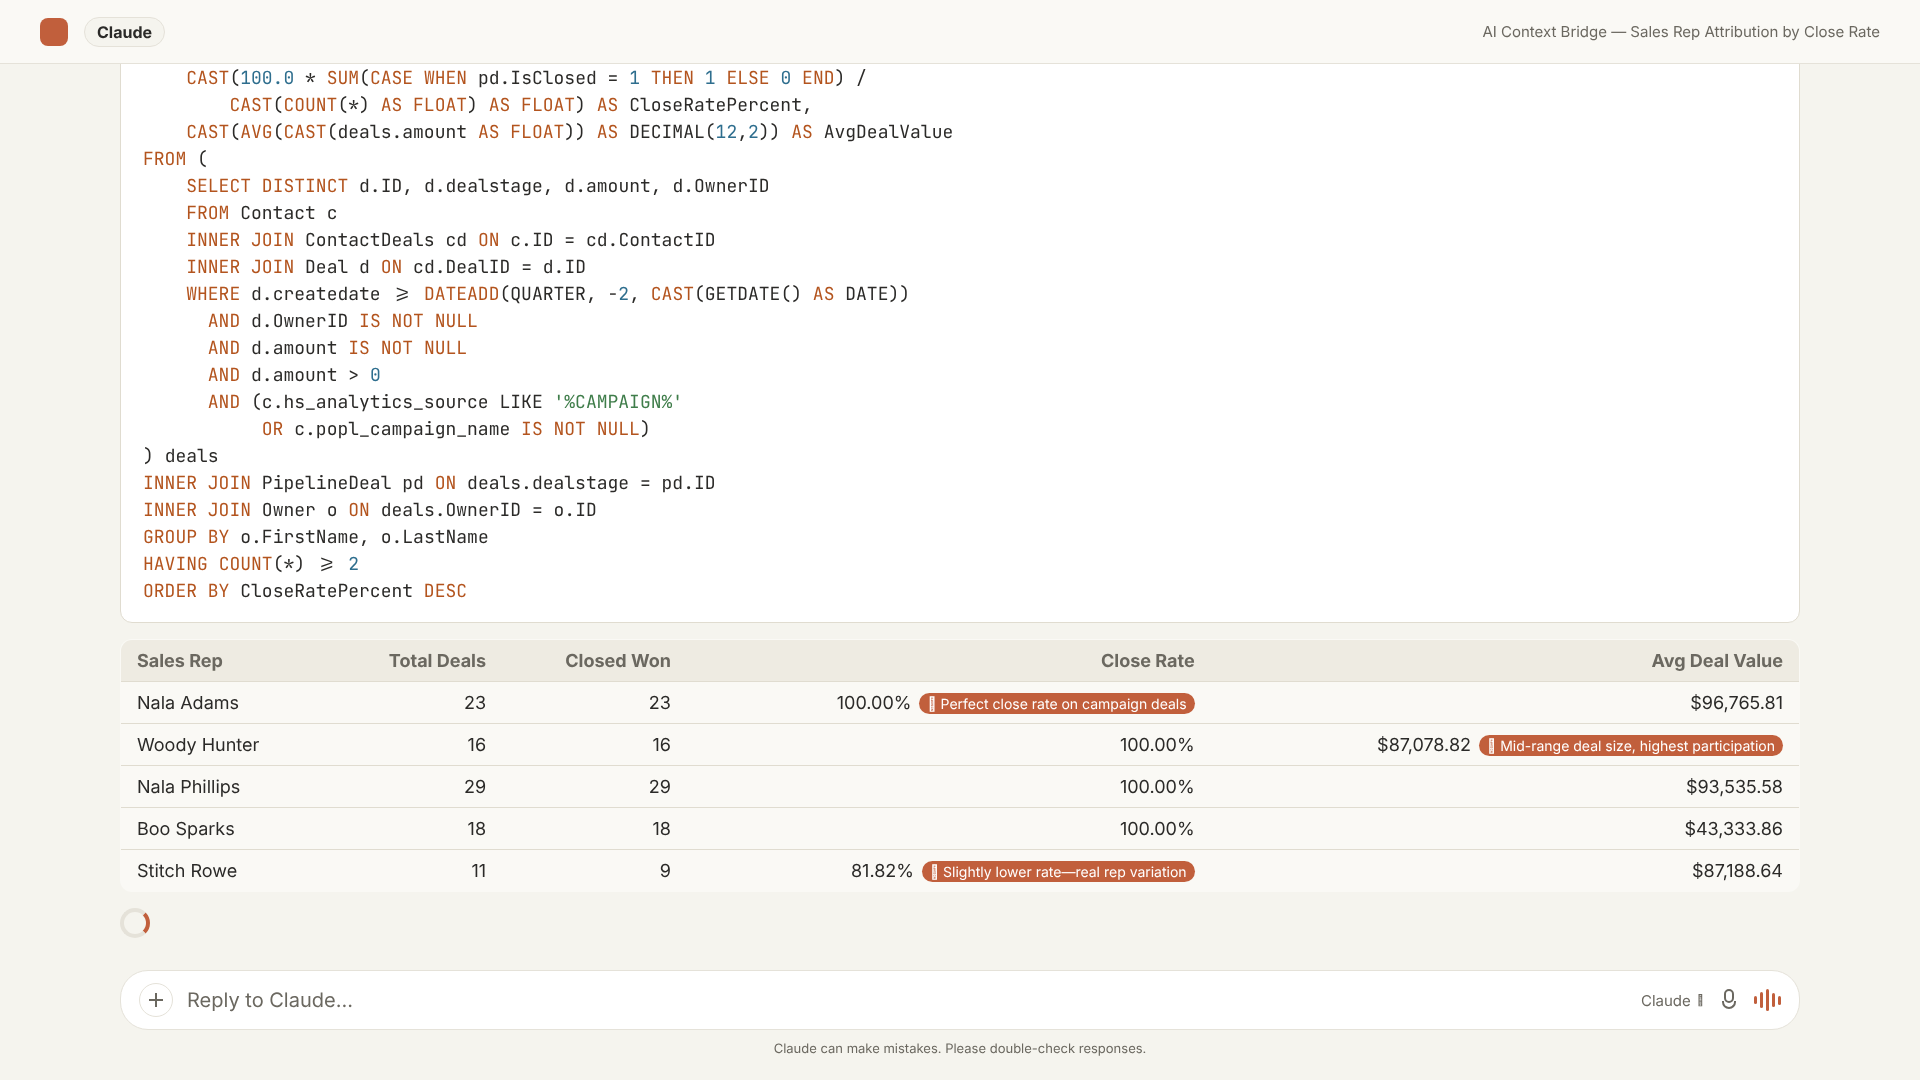
This query answers: "For deals from marketing-sourced contacts in the last two quarters, which sales reps have the highest close rate, and what is their average deal value?" It spans contacts filtered by original source, their associations to deals, and deal ownership: computing close rate as a derived column rather than two separate reports later joined in a spreadsheet.
What This Means for Your RevOps Stack
Moving multi-object analytics out of HubSpot's report builder and into SQL does not replace HubSpot. Pipelines, sequences, activities, and standard dashboards all continue as before. What changes is the answer you get when a question exceeds what the report builder can produce natively.
Instead of four CSV exports and 45 minutes assembling a spreadsheet, you ask in plain English and get back a result grounded in the same underlying data: joined correctly, aggregated in one pass, and re-runnable on demand whenever the underlying records change. Questions about territory attribution, email-campaign conversion, rep performance by marketing source, and ARR concentration by company size shift from being costly to assemble to being fast to answer.
These are also the questions that surface in quarterly business reviews, forecast calibration calls, and pipeline reviews. Getting to clean, reproducible answers fast enough to be useful in those meetings - and fast enough to handle the inevitable follow-up question. That is a material RevOps capability, not just a tooling preference.
Getting Started
AI Context Bridge connects to HubSpot via OAuth and begins syncing on a configurable schedule. The MCP endpoint works with both Claude and ChatGPT. Pricing starts at $0 for a daily-sync tier.
If your current HubSpot reporting is hitting a ceiling on questions that require three or more object types, attribution logic that needs intermediate result sets, or win-rate calculations that HubSpot's aggregation layer cannot express in one report, the approach described here is designed specifically for that gap.