
HubSpot's native reporting is genuinely useful for the questions it was designed to answer. Stage-level deal counts, rep activity summaries, contact lifecycle reports: these work well. The limitation surfaces the moment a revenue question requires crossing more than two associated CRM objects in a single calculation, and that limitation is structural, not configurational.
This post explains what that structural ceiling looks like in practice, which revenue metrics it blocks, and how SQL joins, paired with a real relational schema synced from your HubSpot data, give RevOps and Finance teams the full picture.
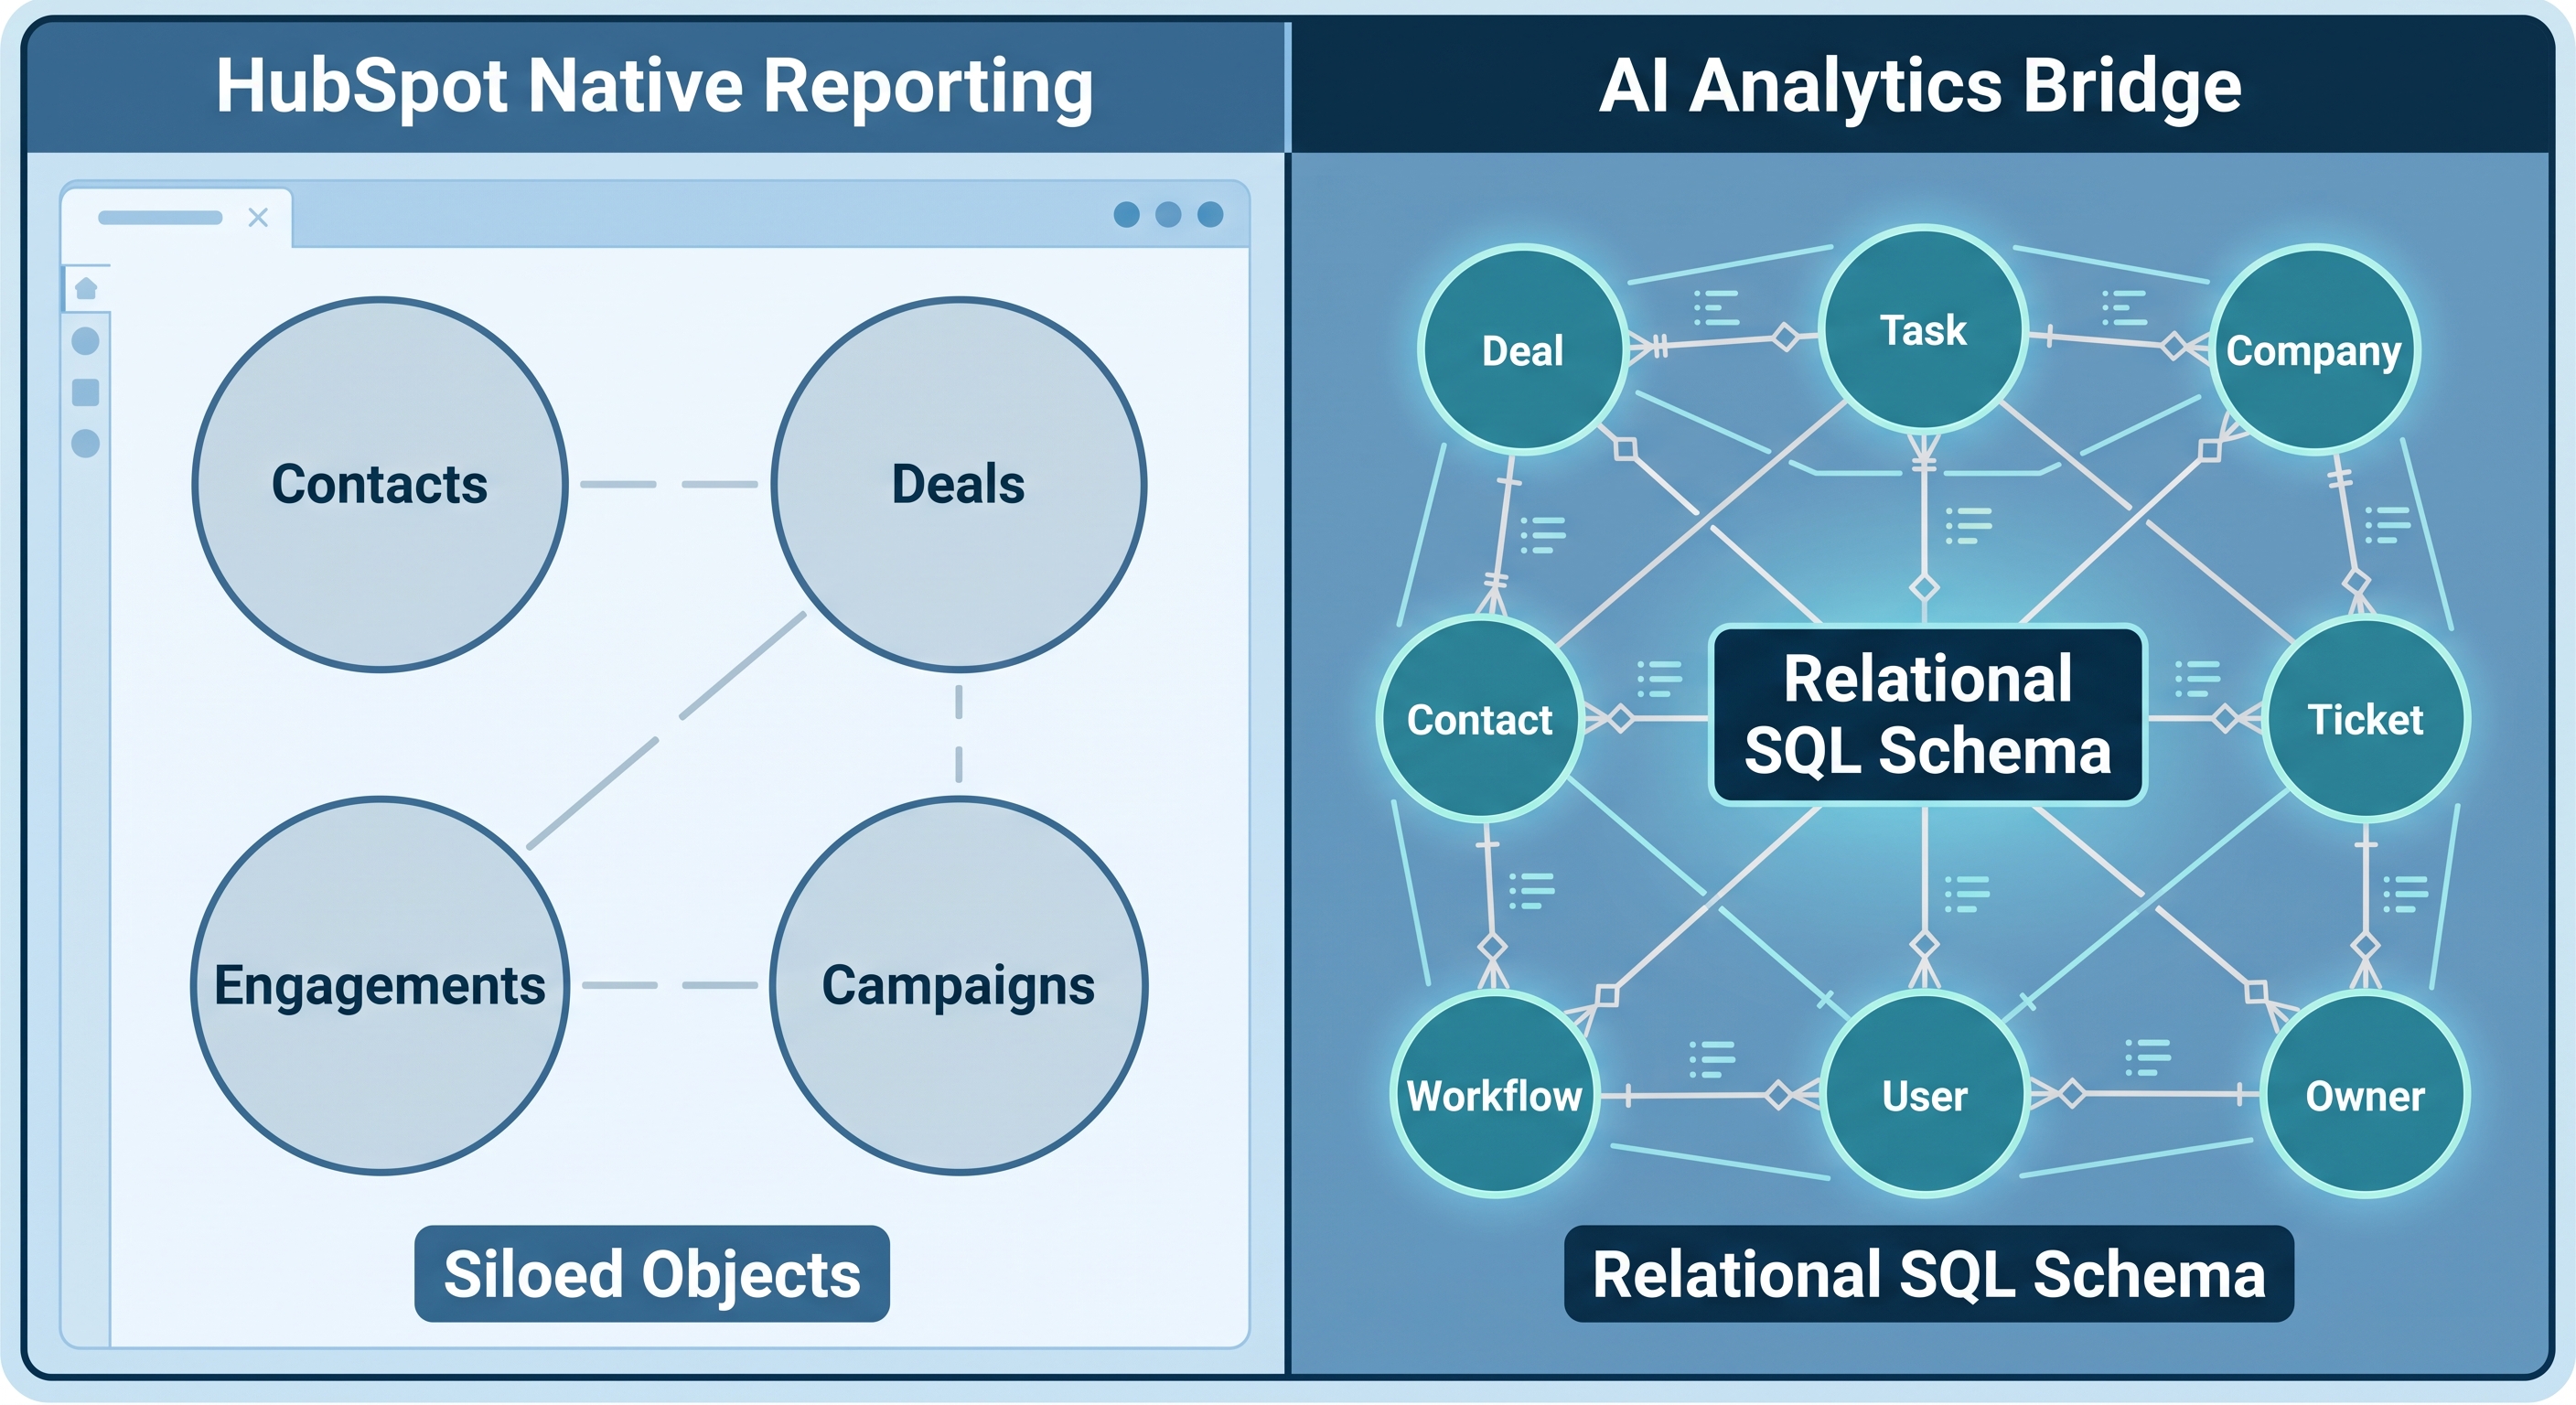
What the Association Cap Actually Is
HubSpot's report builder works on a primary object: Deals, Contacts, Companies, Line Items, and so on. Cross-object reporting uses dot-notation associations, where you traverse from one object to an associated one: Deal → Company, for example. Even in Enterprise, the custom report builder permits a second associated type: Deal → Company → Contact. Two hops is the realistic ceiling.
Line Items are where this ceiling becomes a hard stop. A Line Item is associated with a Deal, which is associated with a Company. The chain is: Line Item → Deal → Company. That is three objects. HubSpot's report builder cannot produce a single report spanning all three.
Custom Objects introduce the same problem from a different angle. If you have a Custom Object called Contract Tier or Product Family that is associated with Deals, any report that also needs Company-level attributes (region, segment, employee count) requires joining: Custom Object → Deal → Company. Again, three objects. Not supported natively.
The Revenue Metrics That Fall Through the Gap
The questions blocked by this ceiling are not edge cases. They come up regularly in RevOps and Finance planning:
Revenue by product and segment. If you sell a platform with add-on modules, deal amounts are split across line items by SKU. Understanding which product mix drives the most revenue in which customer segment requires joining Line Items to Deals to Companies, then grouping by both product and company attributes. HubSpot cannot produce this in a single report.
ARR concentration analysis. What percentage of your annual recurring revenue comes from Enterprise accounts? This calculation requires company headcount from the Company object, ARR from Line Items, and deal-stage filtering to isolate closed-won deals. Three objects, plus a share-of-total calculation (an aggregate of an aggregate) that HubSpot's engine cannot express at all.
Renewal and expansion cohort analysis. Linking an original closed-won deal to its renewal deal, to the line items on both, to the shared Company record, is a four-object join. SQL handles this in a single CTE. HubSpot's report builder does not.
Custom Object segmentation. If your business qualifies companies by a custom attribute stored in a Custom Object (contract tier, product line, territory assignment), any report correlating that attribute with deal revenue and company demographics requires traversing the Custom Object, the Deal, and the Company simultaneously.
How SQL Joins Solve This
A SQL JOIN clause tells a relational database to combine rows from two tables wherever a shared key matches. Chaining multiple joins extends this to any number of tables, with no built-in limit analogous to HubSpot's association cap.
Here is a three-object join across Line Items, Deals, and Companies:
SELECT
    c.name                       AS company,
    c.numberofemployees          AS employees,
    COUNT(DISTINCT d.hs_deal_id) AS closed_deals,
    SUM(li.amount)               AS total_revenue
FROM dbo.Companies c
JOIN dbo.Deals d    ON d.associated_company_id = c.hs_object_id
JOIN dbo.LineItems li ON li.associated_deal_id  = d.hs_deal_id
WHERE d.dealstage = 'closedwon'
GROUP BY c.name, c.numberofemployees
ORDER BY total_revenue DESC;
Every row in the result carries company name, employee count, deal count, and revenue rolled up from line items, in a single query pass with no manual Excel merge required.
More advanced revenue metrics require window functions: SQL expressions that reference an aggregate value across the entire result set without collapsing the rows. The classic example is computing a share of total:
WITH company_arr AS (
    SELECT
        c.name,
        CASE
            WHEN c.numberofemployees >= 1000 THEN 'Enterprise (1,000+)'
            WHEN c.numberofemployees >= 200  THEN 'Mid-Market (200-999)'
            WHEN c.numberofemployees >= 50   THEN 'SMB (50-199)'
            ELSE 'VSB (< 50)'
        END AS employee_band,
        SUM(li.amount) AS total_arr
    FROM dbo.Companies c
    JOIN dbo.Deals d    ON d.associated_company_id = c.hs_object_id
    JOIN dbo.LineItems li ON li.associated_deal_id  = d.hs_deal_id
    WHERE d.dealstage = 'closedwon'
    GROUP BY c.hs_object_id, c.name, c.numberofemployees
)
SELECT
    employee_band,
    COUNT(*)       AS companies,
    SUM(total_arr) AS band_arr,
    CAST(SUM(total_arr) * 100.0 / SUM(SUM(total_arr)) OVER ()
         AS DECIMAL(5,1))        AS arr_share_pct
FROM company_arr
GROUP BY employee_band
ORDER BY band_arr DESC;
The expression SUM(SUM(total_arr)) OVER () is an aggregate of an aggregate: the inner SUM produces per-band totals, and the outer SUM ... OVER () computes the grand total across all bands so the percentage can be derived in a single pass. HubSpot's native engine, Enterprise tier included, cannot express this pattern.
The Relational Foundation AI Context Bridge Produces
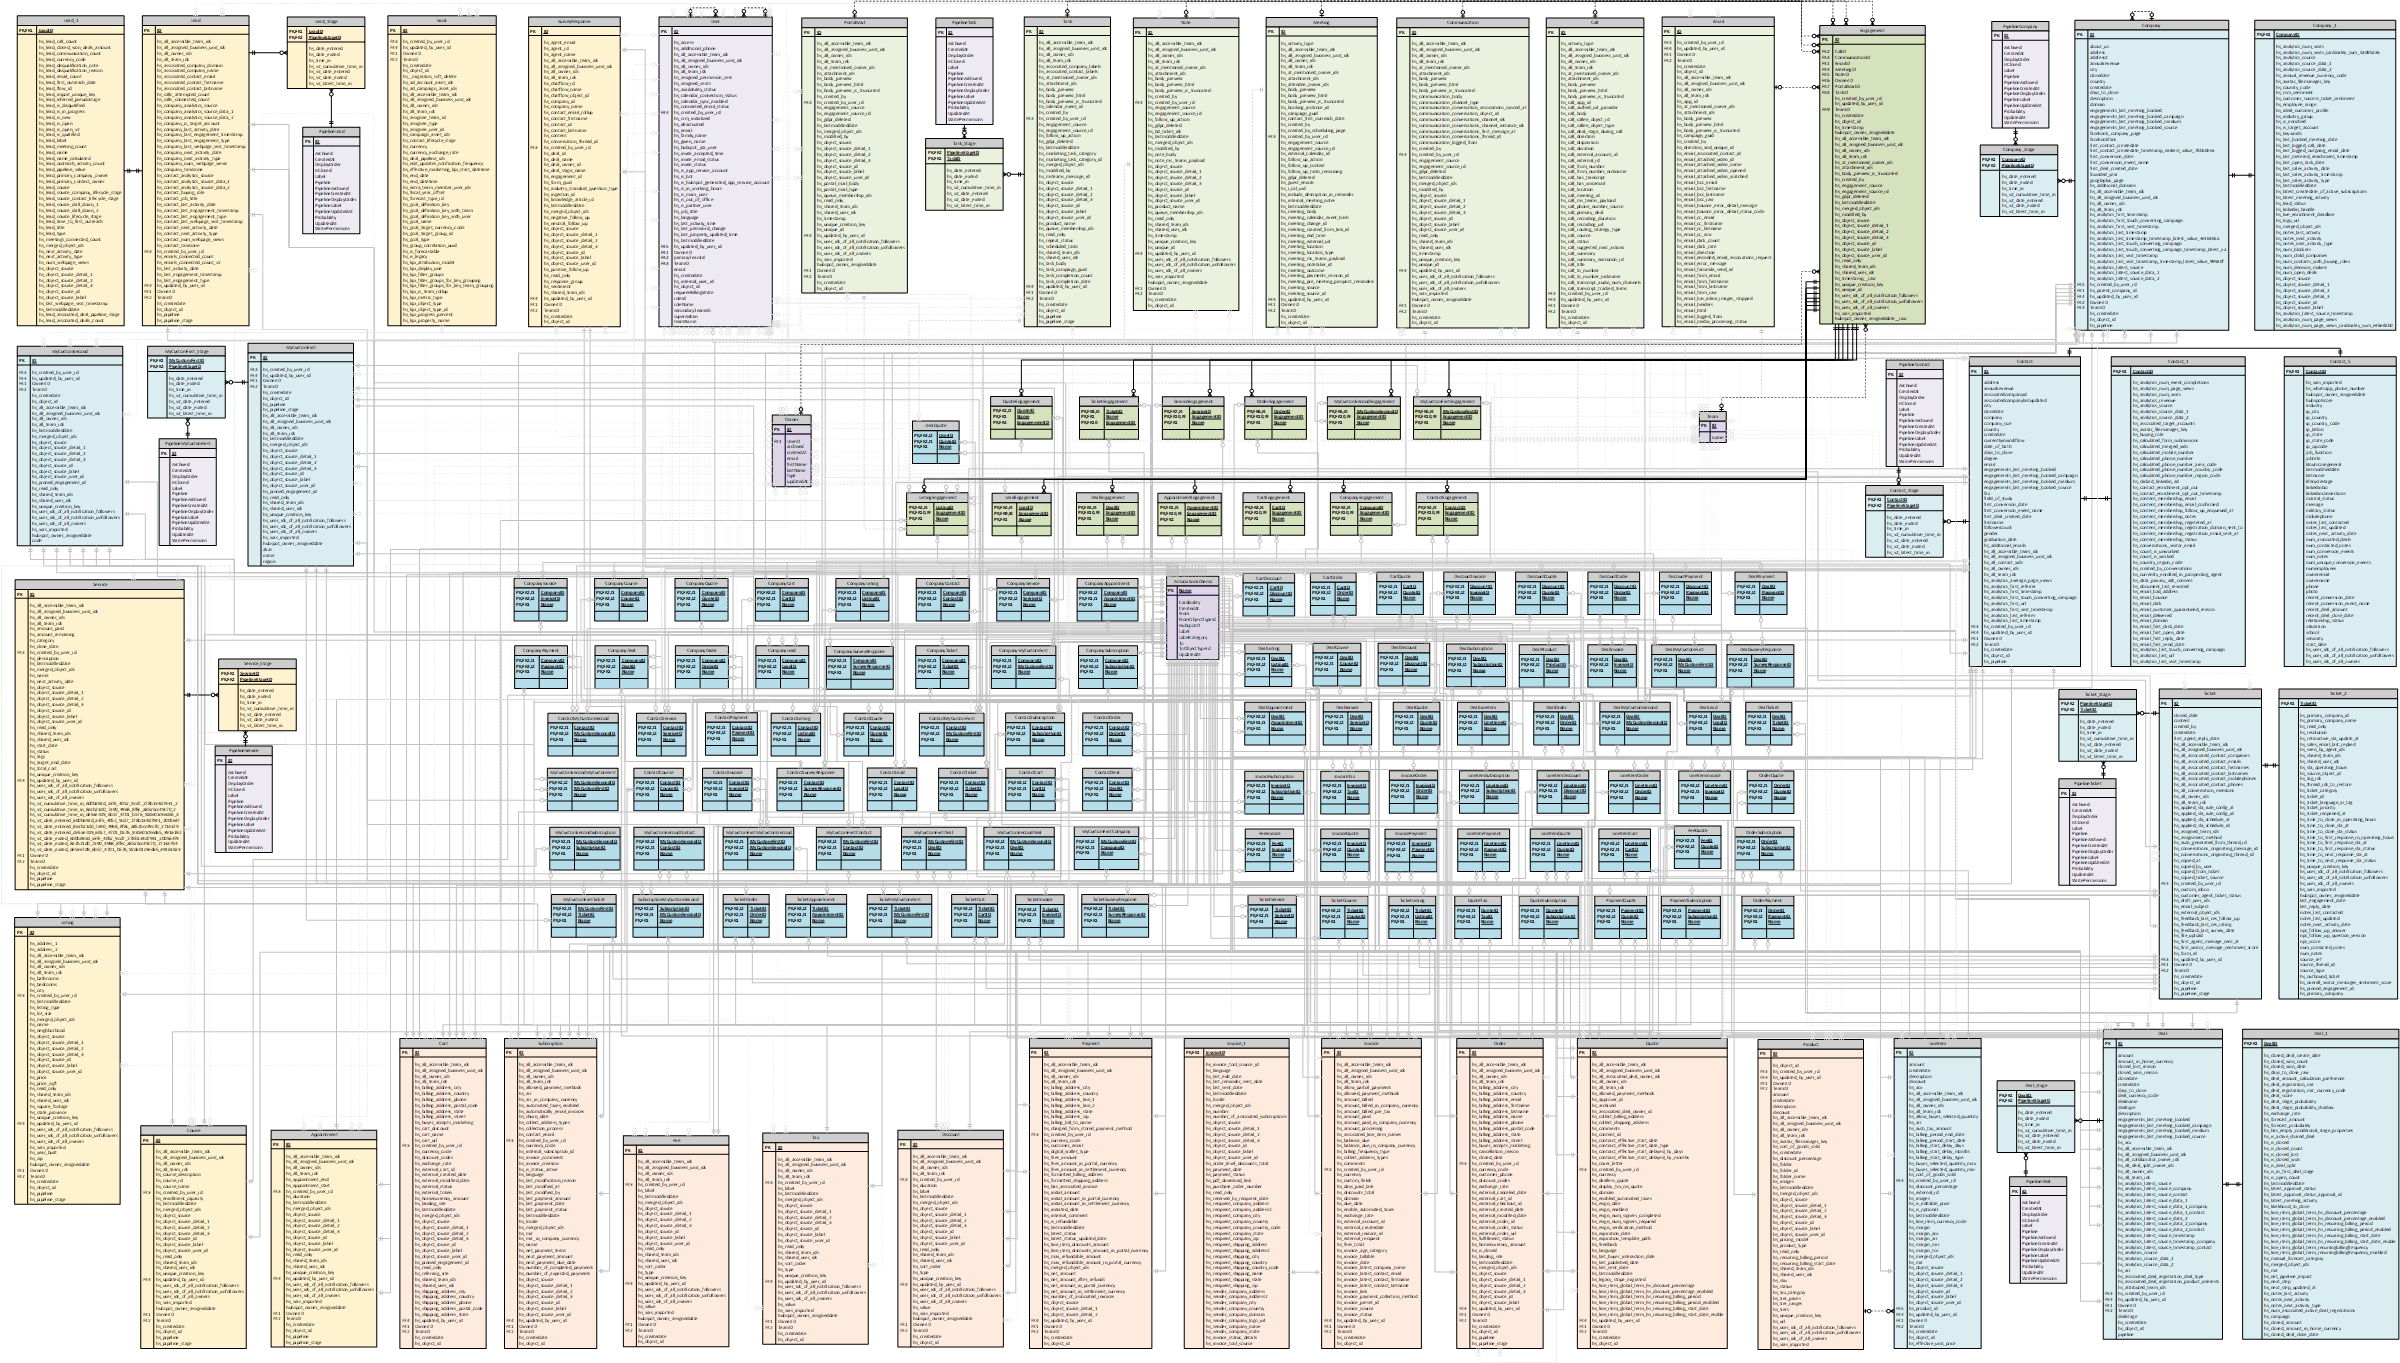
The SQL examples above work because AI Context Bridge for HubSpot syncs your HubSpot data continuously into a real SQL Server schema. Each HubSpot object type becomes its own table. Associations become foreign key relationships. The result is a normalized relational database that any SQL query, BI tool, or AI assistant can work against directly.
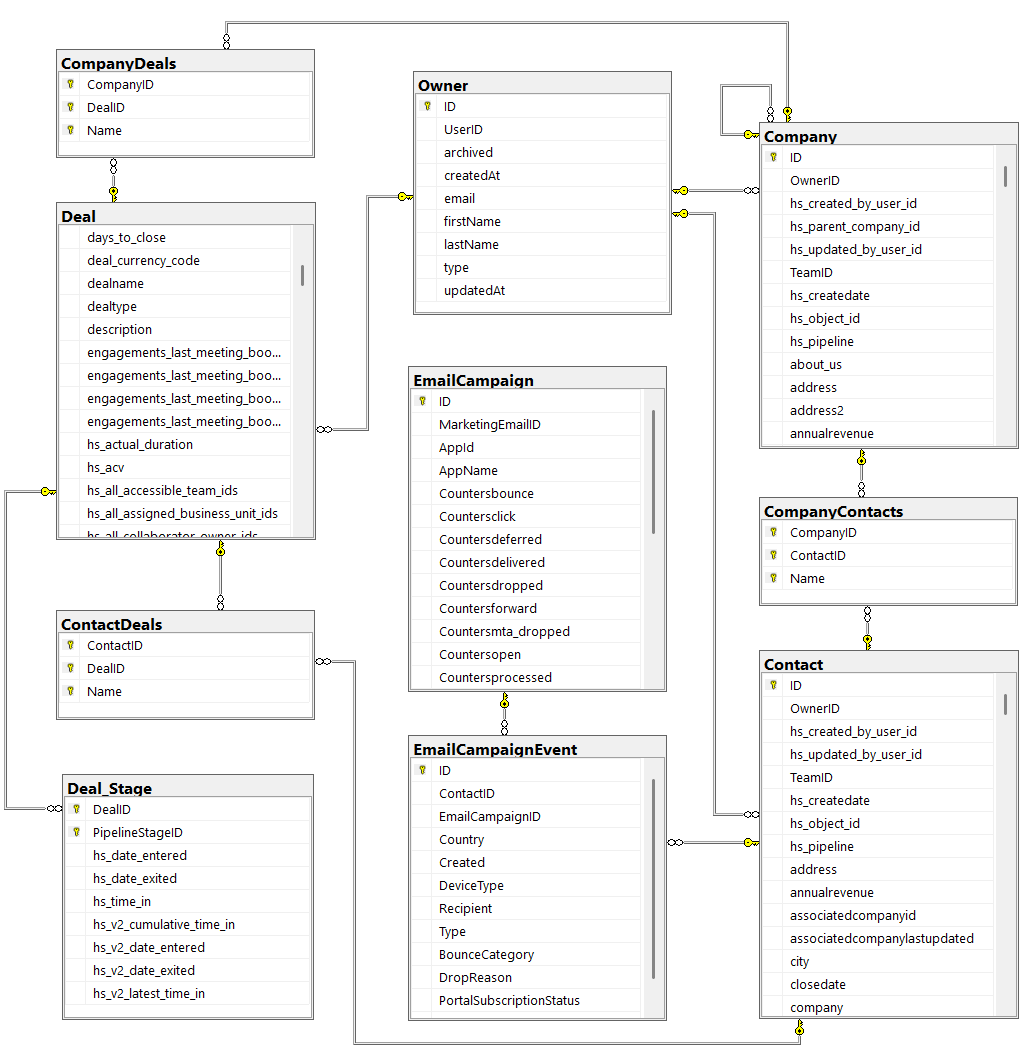
The schema above shows distinct, typed tables for Deals, Contacts, Companies, Line Items, and Engagements, each with its own columns and the join keys that link them. This is the relational structure that makes three-object and four-object queries possible.
Asking Revenue Questions in Plain English
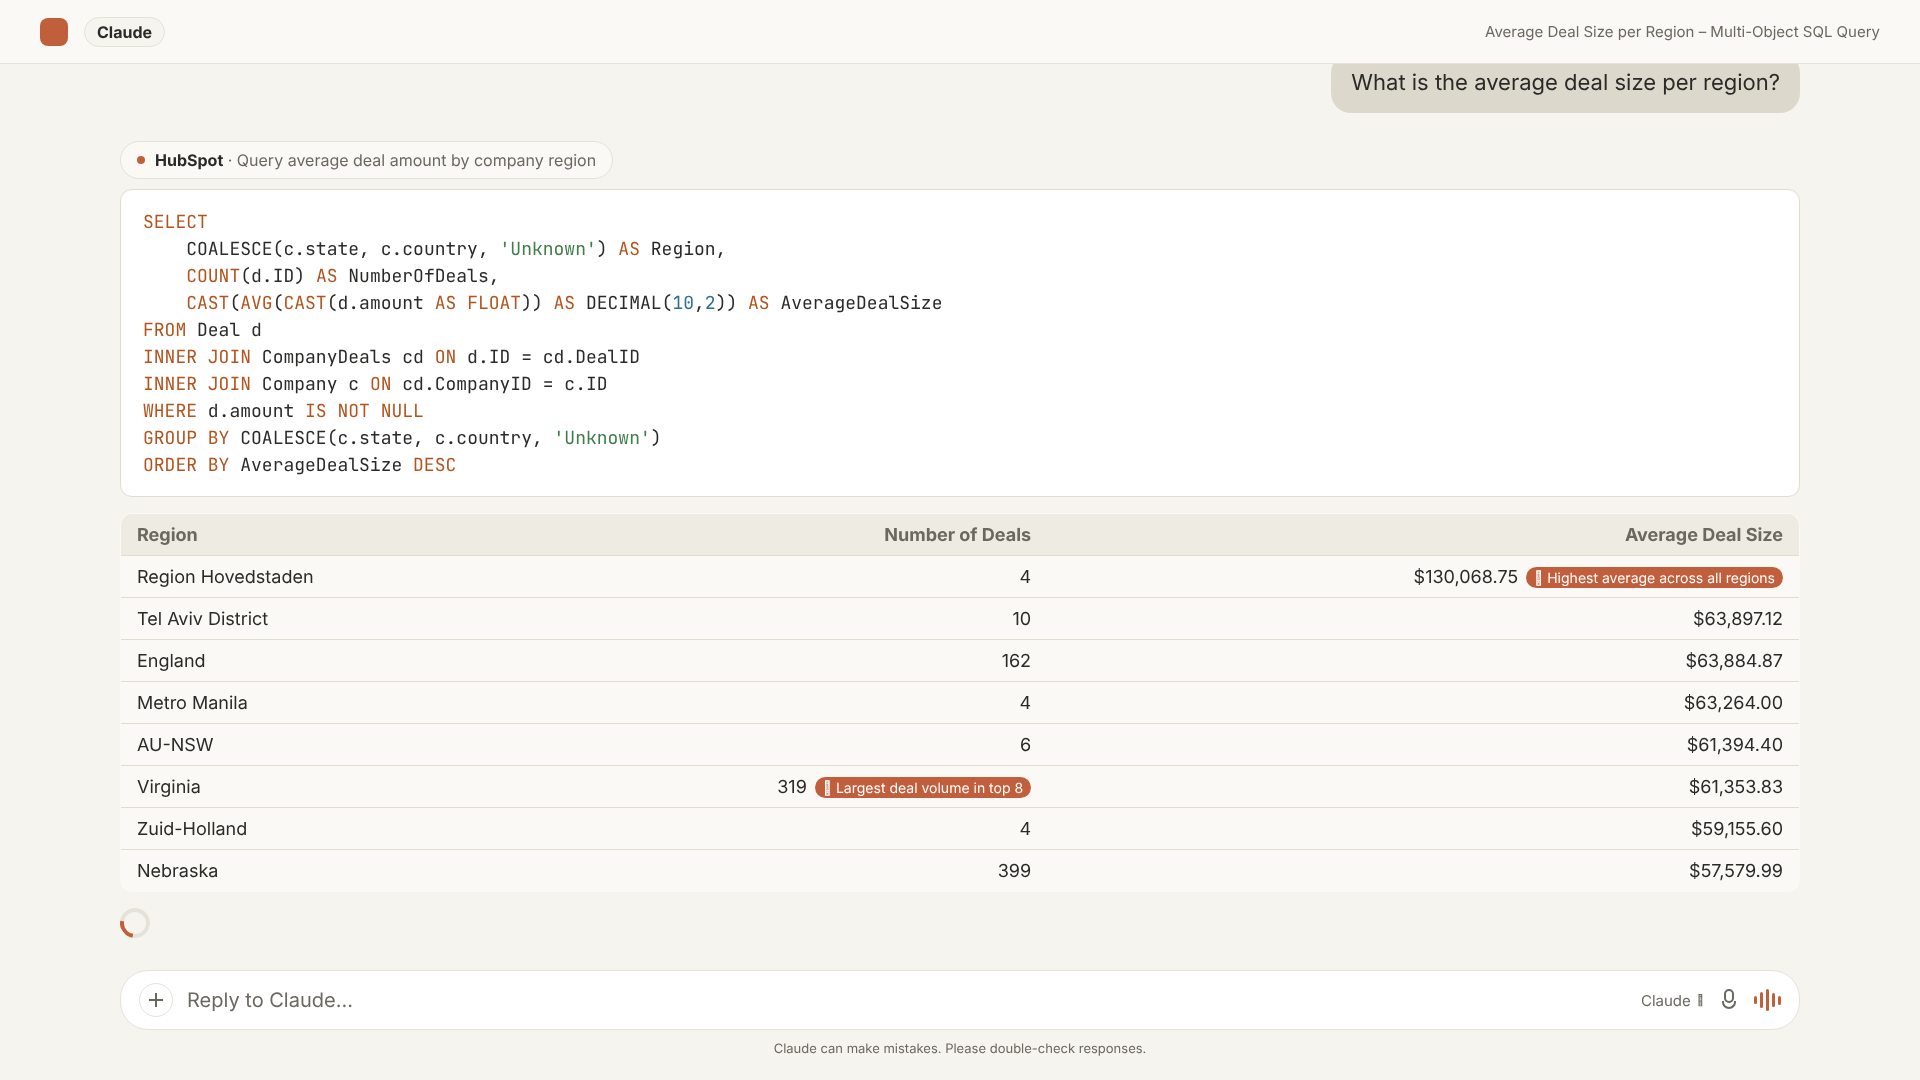
The relational schema is one half of the solution. The other half is accessibility: RevOps analysts and Finance leads should not need to hand-write T-SQL to get answers. DataLabs.store exposes the schema to Claude or ChatGPT through an MCP endpoint, so you can ask a revenue question in plain English and receive both a result table and the exact SQL query that produced it.
Example: Average deal size by region. Region is a property on the Company object. Deal amount lives on the Deal object. In HubSpot, these are separate objects accessible only through a dot-notation association. Via the MCP endpoint, you ask: "What is the average deal size per region?" The AI writes a Company–Deal join, executes it against your data, and returns a result table.
For more complex queries (CTEs, window functions, multi-stage revenue attribution), the AI scaffolds the full query structure, not just a simple aggregation.
ARR Concentration by Company Size: A Window Function in Practice
The ARR concentration query described earlier (employee band, logo share, total ARR, ARR share, average deal size) is the kind of query DataLabs.store ran live against a demo HubSpot portal to validate this capability.
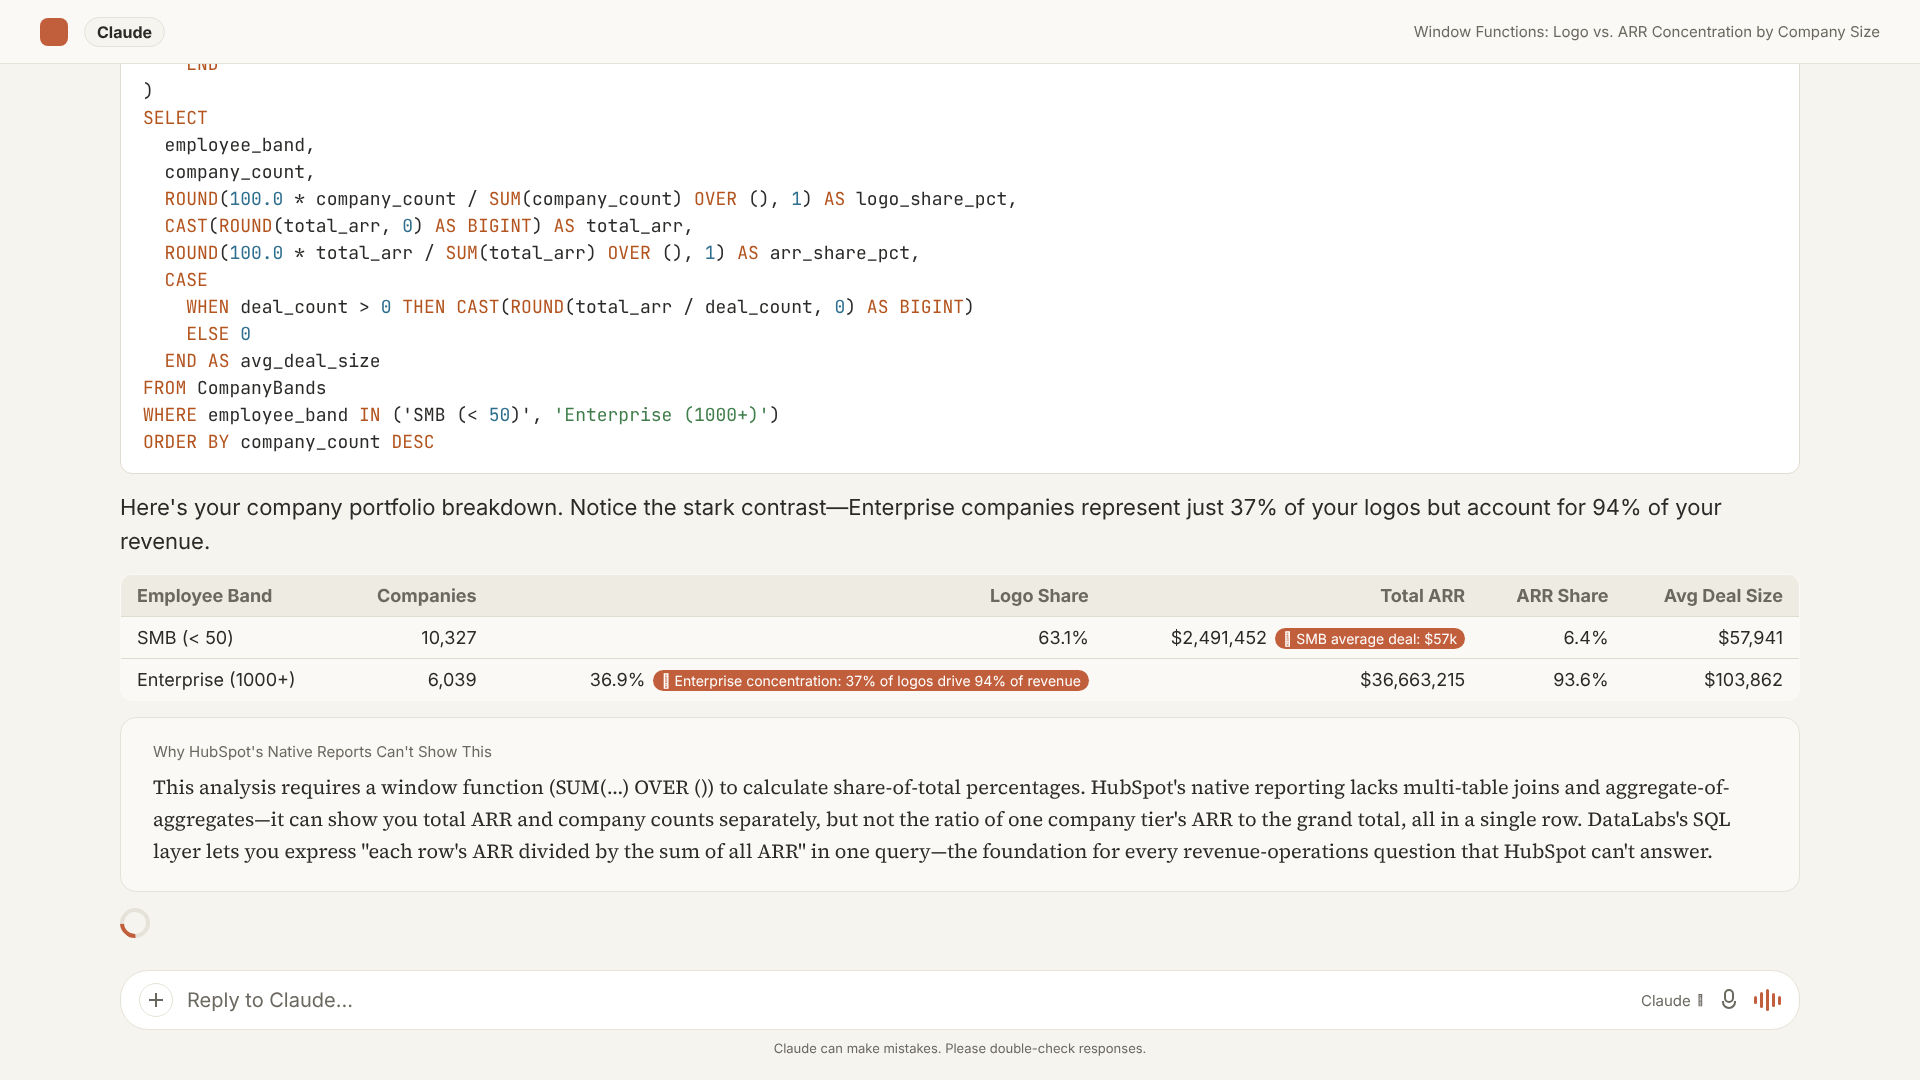
The result shows Enterprise accounts (1,000+ employees) representing 71.9% of logos and 92.7% of ARR, with an average deal size of $312,570 against SMB's $69,372. This is exactly the kind of concentration analysis that informs pricing tier decisions, customer success resource allocation, and churn risk modeling. The query runs in under a second, and the SQL that produced it is shown below the result table in the chat interface, fully auditable.
HubSpot's native reporting would require exporting Company data, exporting Deal data, merging the two manually in Excel, defining employee-band buckets by hand, then repeating the process whenever the numbers need updating.
What This Means for Your RevOps Workflow
The association cap is a ceiling, not a configuration problem. The path around it is getting your HubSpot data into a system designed for relational queries and querying it with the right tool.
AI Context Bridge for HubSpot provides the data layer: continuous OAuth sync into a normalized SQL Server schema, exposed through an MCP endpoint to Claude or ChatGPT. The result is a workflow where your revenue analyst can ask a multi-object question in plain English and receive an auditable answer in seconds, not a spreadsheet assembled over the weekend.
The queries shown in this post (Line Items joined to Deals joined to Companies, window functions computing ARR share, CTE chains for renewal cohort analysis) are not prototypes. They are the kinds of queries the MCP endpoint runs routinely against a live relational replica of a HubSpot portal.
If the questions in this post match the ones your Finance or RevOps team is already asking, the structural answer is a relational schema, not a more sophisticated use of HubSpot filters.