
Every RevOps practitioner has been here: a senior leader asks why last quarter's marketing spend didn't show up in closed revenue, and the answer requires pulling three separate HubSpot exports into a spreadsheet before you can even begin to answer. That is not a workflow problem. It is a structural one.
HubSpot's reporting engine is built around a single-object model. Each report lives inside one object type - Contacts, Companies, Deals, or Marketing Emails - and while you can filter and group within that object, you cannot JOIN across them in any analytical sense. You cannot ask: for each email campaign, how many engaged contacts eventually became a deal, and how many days did that take? You cannot ask: which customer segments drive the most ARR, and how does that compare to their share of your logo count? Both questions require joining tables. HubSpot's report builder has no concept of a table join.
The result is that RevOps teams own a manual reconciliation layer - exporting, matching in Excel, reconciling columns that don't quite align - just to answer questions that should be a single query.
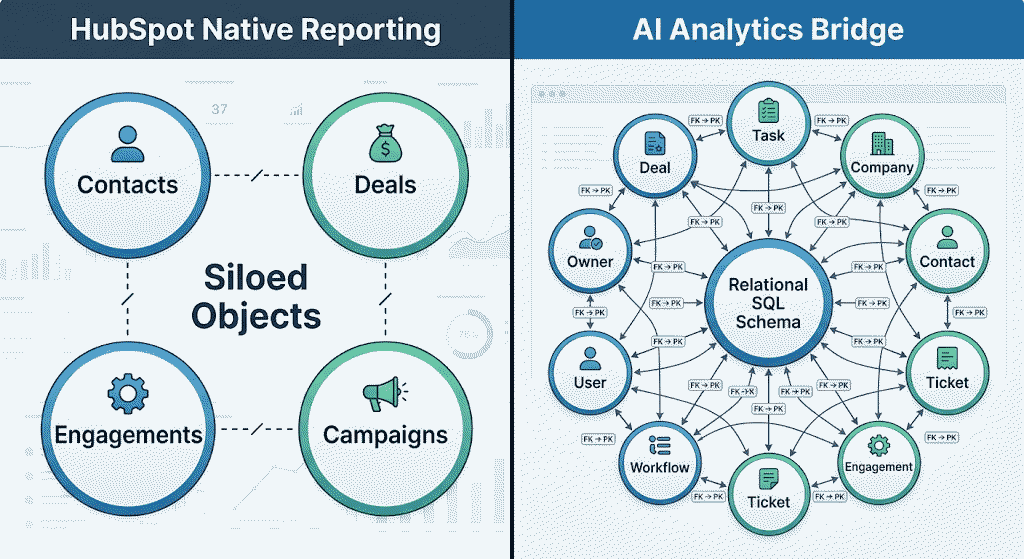
Why HubSpot's Architecture Creates This Ceiling
HubSpot's report builder is optimized for operational questions within a single object: how many deals moved to Closed Won this week, which contacts opened an email, how many new companies were created. All useful. The moment a question crosses an object boundary, you're on your own.
Even HubSpot's revenue attribution reporting - which does try to connect marketing activity to closed revenue - is Marketing Hub Enterprise only, uses fixed attribution models (first-touch, last-touch, linear), and gives you no control over join logic or timing windows. You cannot define "first deal within 90 days of email engagement" yourself. You get the model HubSpot decided to give you.
The more complex RevOps questions: which email types actually convert, which customer segments have disproportionate ARR concentration, which deals have been sitting in a stage your pipeline report doesn't flag. All require multi-table logic. JOINs. CTEs. Window functions. None of those constructs exist in HubSpot's reporting layer.
Two Charts That Tell Opposite Stories
Here is a question a CS or finance leader might ask: which customer segments are actually driving our revenue?
The instinct is to pull a company count by employee-size band. But logo count and ARR concentration often tell completely different stories - and knowing which story is true determines where you invest in CS headcount, renewal programs, and executive relationship coverage.
We ran this analysis against the DataLabs DEMO HubSpot portal: 490 companies with ARR populated. Segmenting by employee-count band and computing each band's share of total logos vs. share of total ARR requires a window function: SUM(arr) OVER() to get the grand total, then each band's ARR divided into it. That is a single SQL construct. HubSpot's report builder has no equivalent.
Here is what the data showed across the companies with employee count populated:
| Band | Companies | Logo Share | Total ARR | ARR Share | Avg Deal Size | |---|---|---|---|---|---| | Enterprise (1,000+ employees) | 69 | 71.9% | $21,567,311 | 92.7% | $312,570 | | SMB (fewer than 50 employees) | 5 | 5.2% | $346,858 | 1.5% | $69,372 |
Enterprise accounts represent 71.9% of the logos in this dataset but 92.7% of ARR. The average Enterprise deal size is 4.5x the average across every other segment combined. The SMB band is 5.2% of logos and 1.5% of ARR: present on the logo chart, essentially invisible on the revenue chart.
If you are making CS investment decisions from a logo-count dashboard, you may be allocating headcount and renewal coverage in proportion to a metric that has almost no relationship to revenue concentration in your actual book of business.
Native HubSpot can give you logo count by segment, or ARR by segment, in separate reports. Computing the percentage-of-total for each - the number that makes the gap visible - requires either a manual pivot step in a spreadsheet or a window function that the report builder cannot produce.
Which Emails Actually Drive Revenue
Here is a question marketing and RevOps fight about in almost every company: are our email campaigns producing pipeline, or just reach?
We ran this analysis against the DEMO portal's full email engagement dataset: 2,255,945 rows across 20,910 distinct contacts. The query traces every email engagement through to each engaged contact's first-ever deal. The join path is EmailCampaignEvent → Contact → ContactDeals → Deal, with a CTE to isolate first-touch attribution and a minimum sample threshold to exclude campaigns too small to be statistically meaningful.
HubSpot has no native path between these objects in a single report.
The finding:
- Targeted, low-volume sends (52–90 engaged contacts - weekly market summaries and similar) converted at 1.9–2.6%, with deals arriving in 27–42 days.
- Mass-blast campaigns (1,531–3,643 engaged contacts - press releases, webinar invites) converted at 0.1–0.4%: a 5–20x gap in the opposite direction from what raw reach numbers would suggest.
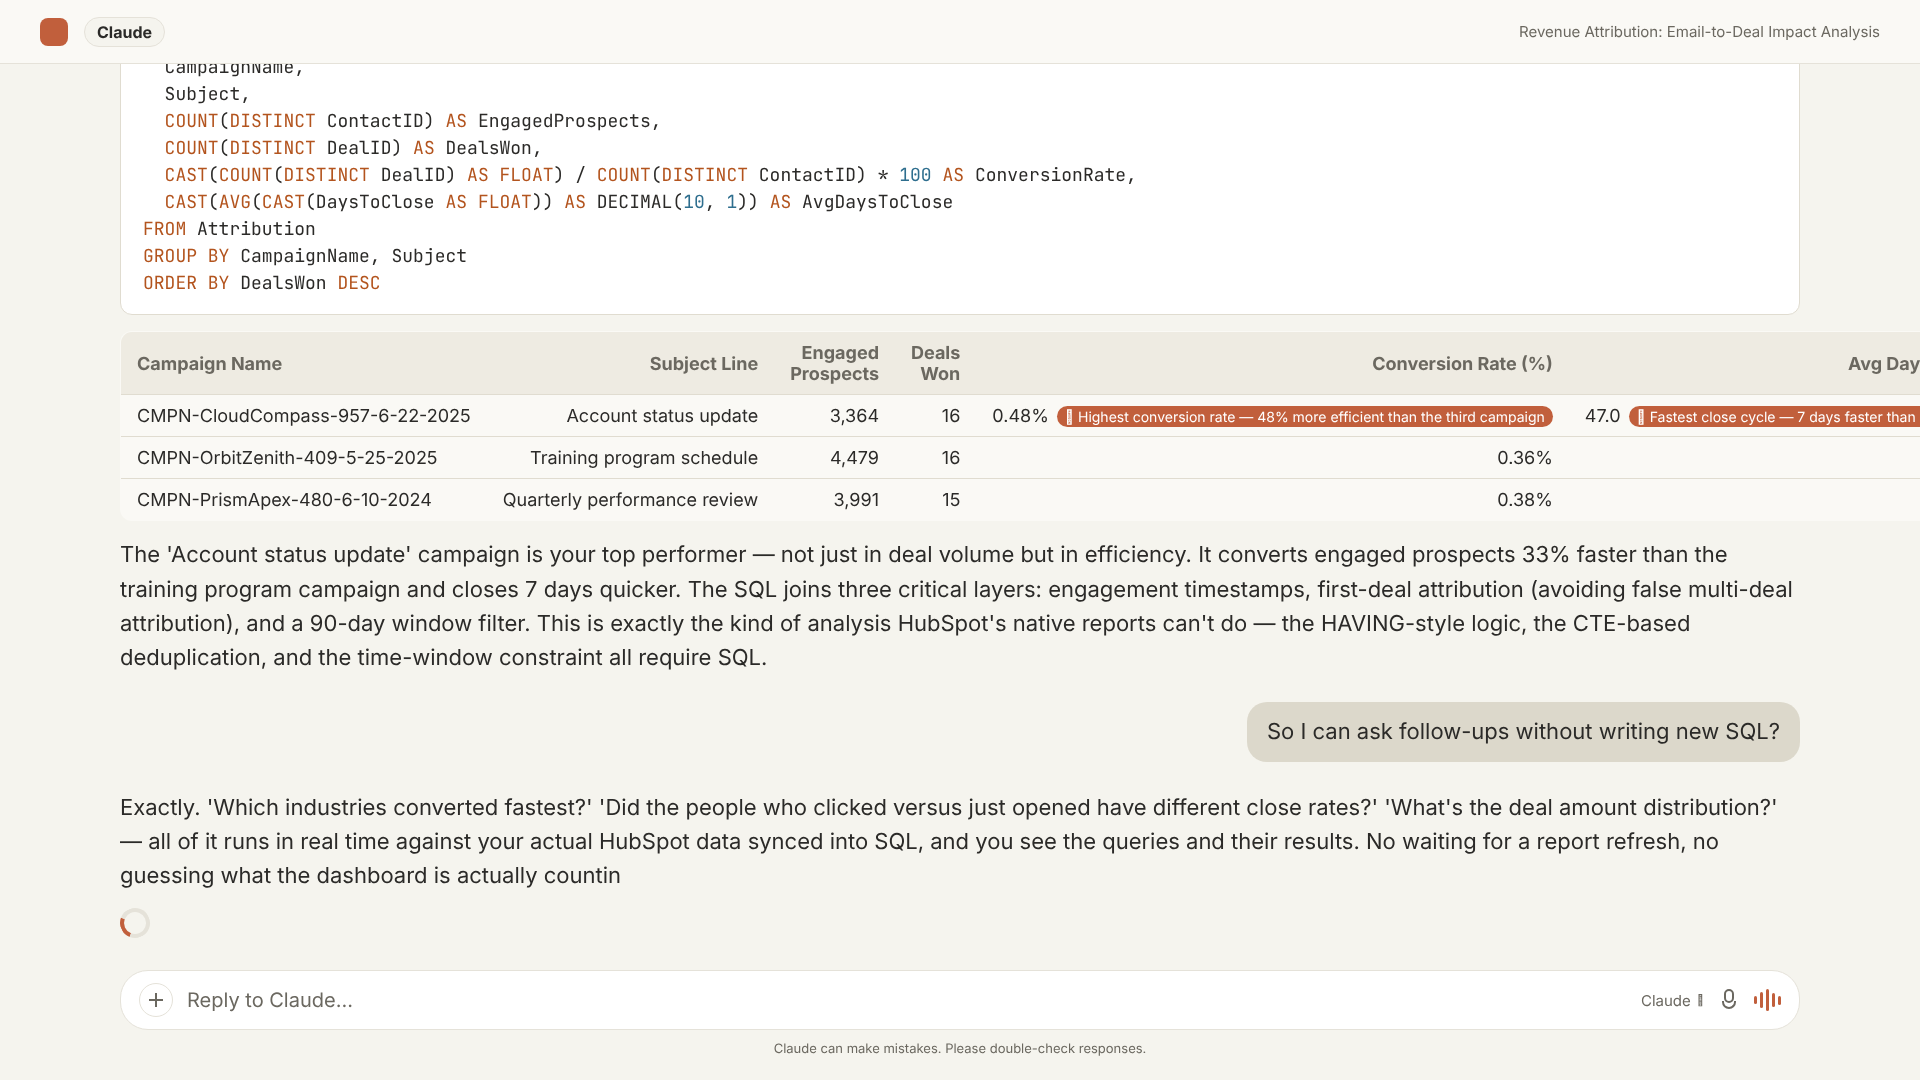
There is also an honest null result worth naming. We bucketed contacts by how many times they opened the same email (once, 2–3 times, 4 or more) and found conversion rates were essentially flat: 0.11%, 0.14%, 0.11%. Repeat opens are not a reliable buying-intent signal in this data. If your team is prioritizing outreach based on open count, that is worth re-examining.
The closest native HubSpot equivalent - revenue attribution reporting - is Marketing Hub Enterprise only, uses fixed attribution models, and gives you no way to define your own timing windows or sample floors. You cannot write "show me only campaigns with at least 25 engaged contacts, and only deals that occurred within 90 days" in HubSpot's report builder.
How AI Context Bridge for HubSpot Works
AI Context Bridge for HubSpot - the flagship product from DataLabs.store - solves this at the infrastructure layer, not the dashboard layer.
Step 1: OAuth sync to SQL Server. Connect your HubSpot portal via OAuth. AI Context Bridge syncs your data - Contacts, Companies, Deals, Engagements, email events, custom properties - into a real Microsoft SQL Server database. Not a flat export: a normalized relational schema with proper foreign keys, the kind that supports JOIN, GROUP BY, and window functions without any intermediate transformation step.

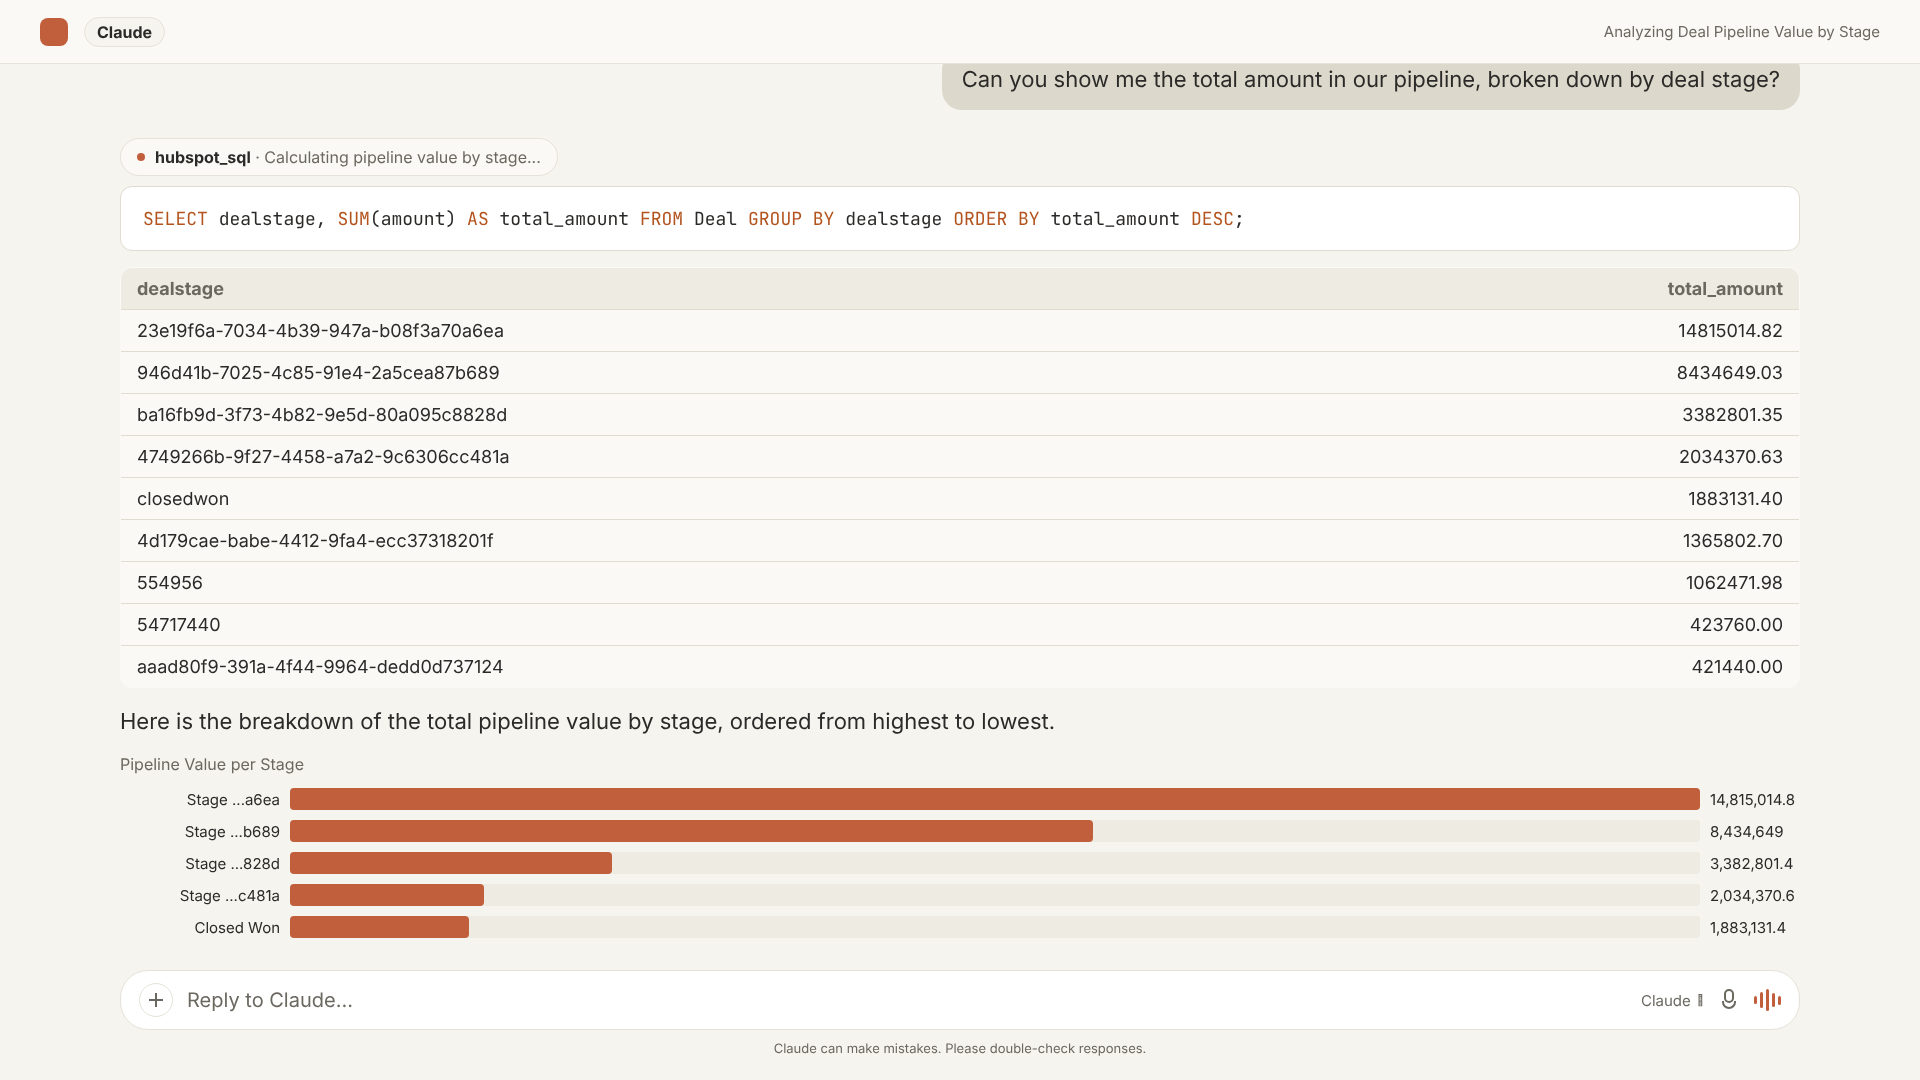
Step 2: MCP endpoint. The SQL Server database is exposed through a Model Context Protocol (MCP) endpoint that Claude or ChatGPT connects to. You ask a question in plain English. The AI writes the SQL against your actual data, runs it, and returns both the result and the underlying query: visible, auditable, and modifiable.
Step 3: Auditable answers. Every response shows its SQL. If a query joins three tables and uses a window function, you see those three tables and that window function. There is no fixed attribution model hiding the logic. If the query needs adjustment, you ask a follow-up question and it updates accordingly.
Pricing starts at a free tier and runs to $159/month, with tiers varying by sync frequency (daily to hourly). You can connect your HubSpot portal and ask your first cross-object question without writing SQL yourself.
The RevOps Questions Worth Asking
The two analyses above illustrate the category of questions that require a JOIN layer:
- Marketing to sales: Which email campaigns produced pipeline? Which content types correlated with shorter sales cycles?
- Sales to CS: Which deal segments have the highest ARR concentration? Which customers look like expansion candidates based on deal history combined with company firmographics?
- CS to finance: Which customer segments are at renewal risk, and what is their combined ARR exposure?
None of these require exotic SQL. They require JOINs: the ability to connect one object to another and ask a question that spans both. HubSpot's architecture does not support that at the reporting layer. A data warehouse, a dbt model, or a full BI stack are all valid solutions, but they are substantial investments with months-long setup timelines. AI Context Bridge is a narrower tool: it solves the reporting-ceiling problem specifically for HubSpot data, using the AI layer to make SQL accessible to people who don't write it.
The logo-vs-ARR and email attribution analyses referenced in this post were run live against the DataLabs DEMO HubSpot portal (490 companies with ARR populated; 2,255,945 email engagement rows across 20,910 distinct contacts). Results reflect DEMO data and will vary by portal.