
Revenue attribution is one of the most valuable analyses a RevOps team can run, and one of the most consistently frustrating to build in HubSpot. Not because the data isn't there. It usually is. But because answering "which campaigns drove revenue, broken down by industry" or "what's our win rate by sales territory" requires the kind of multi-table join that HubSpot's native report builder was never designed to produce.
The specific structural constraint has a name: the 2-association cap.
HubSpot's Report Builder and the Association Limit
HubSpot's custom report builder, available on Professional and Enterprise plans, lets you build cross-object reports by following association paths between record types. A deal is associated with a contact; a contact is associated with a company. So you can build a report showing deal amount alongside company name. Two associated object types: that's the practical ceiling of what dot-notation traversal in the builder can express.
The moment an attribution question requires a third hop - from email event to contact to deal to company, or from deal to contact to a custom Territory object and its parent region - you've gone past what the native builder can express. The Enterprise custom report builder doesn't add arbitrary JOIN depth; it extends the same architectural base with more flexible grouping and filtering options. The fundamental limit on association traversal stays.
This isn't a documentation gap or a configuration error. It's an intentional architectural boundary of the platform.
Three Attribution Questions That Expose the Ceiling
These aren't edge cases. They're the questions RevOps and sales leadership teams ask regularly, and they all hit the same structural wall.
Email-to-Revenue Attribution with Industry Context
"For each campaign we sent last quarter, how many engaged contacts became closed-won deals within 90 days, and what industries were those companies in?"
This question requires connecting email engagement records to contacts, contacts to closed-won deals (filtered to within 90 days of the engagement event), and deals to the company's industry field. That's four objects in sequence: email event, contact, deal, company. The native builder can't express it as a single report.
The closest HubSpot approximation is two separate reports run side by side and manually matched. That isn't attribution modeling. It's a workaround that introduces reconciliation errors and can't be automated.
Territory-Level Pipeline and Win Rate
"Break down our open pipeline and closed-won win rate by sales territory, where Territory is a custom object associated with the contact."
Territory is commonly modeled as a custom object in HubSpot, associated with contacts. Getting from deal → contact → territory, then aggregating pipeline value and wins per territory, requires traversing two associations plus a custom object type. HubSpot's report builder has no path for that join.
Parent-Account Revenue Rollup
"For enterprise accounts where we have a parent company and subsidiary child companies, show total deal value attributed to each parent account."
HubSpot supports company-to-company parent/child associations. But traversing from deal → company (subsidiary) → parent company while summing deal amounts is a two-hop association on the company object alone, compounded by a deal aggregation. Standard and custom reports don't follow company-to-company associations at query time.
Stage Rot: A Related Problem With the Same Root Cause
The attribution ceiling isn't the only place the single-object constraint surfaces. Stage-rot analysis - identifying how much open pipeline value is stuck in a single deal stage past a meaningful threshold - hits the same architectural wall from a different angle.
HubSpot Professional and Enterprise now include a native "Time in current stage" property on deals, so filtering to find which individual deals have been sitting longest in a given stage is a straightforward filter today. What that property doesn't enable is the aggregate view: across all currently open deals, how much total pipeline value has been sitting in each stage past 60 or 90 days, broken out by pipeline and stage?
Answering that requires joining the stage-transition history table to current open deal records, grouping by pipeline and stage, and applying aggregate filters. That's a multi-table join with a history table, a structure HubSpot's standard report builder has no path for.
A query run against the DataLabs DEMO portal (seeded historical data, June 2026) found $3,037,102 in open pipeline stuck past 90 days in a single stage. The breakdown: Main Pipeline/OnHold at $1,439,675 across 23 deals, Main Pipeline/Sales Opportunity at $892,568 across 22 deals, and Migration/Trial at $704,859 across 16 deals. On a live production portal with real data, the same method surfaces 30/60/90-day concentrations at realistic timescales: the specific day-counts in the demo dataset are inflated by seeding and shouldn't be taken as typical. The structural point stands: the aggregate breakdown, by pipeline and stage, requires a join that HubSpot's report builder cannot produce.
What the SQL Actually Looks Like
When HubSpot data lands in a real SQL Server database, these multi-hop attribution questions become standard query patterns. A first-touch email-to-deal attribution query uses a CTE to identify the first email engagement per contact, joins that to contacts, joins contacts to deals filtered by close date and status, joins deals to company industry, and groups the result by campaign and industry. One query. No cross-referencing between separate exports.
For territory-level win rate analysis, the same CTE pattern applies: deal outcomes joined to contacts through the contact-to-deal association table, joined to territory records through the contact-to-territory association table, then grouped by territory with win rate computed as a ratio aggregate. The join chain that HubSpot's builder can't traverse is exactly what SQL handles natively.
For the stage-rot rollup: a CTE capturing the latest stage-entry event per deal from the stage history table, joined to current open deals, with a DATEDIFF calculation for days-in-stage and a HAVING clause filtering to concentrations past the relevant threshold.
None of these are exotic query patterns. They're standard relational SQL. The constraint is getting HubSpot data into a SQL database with the right schema to make those joins clean.
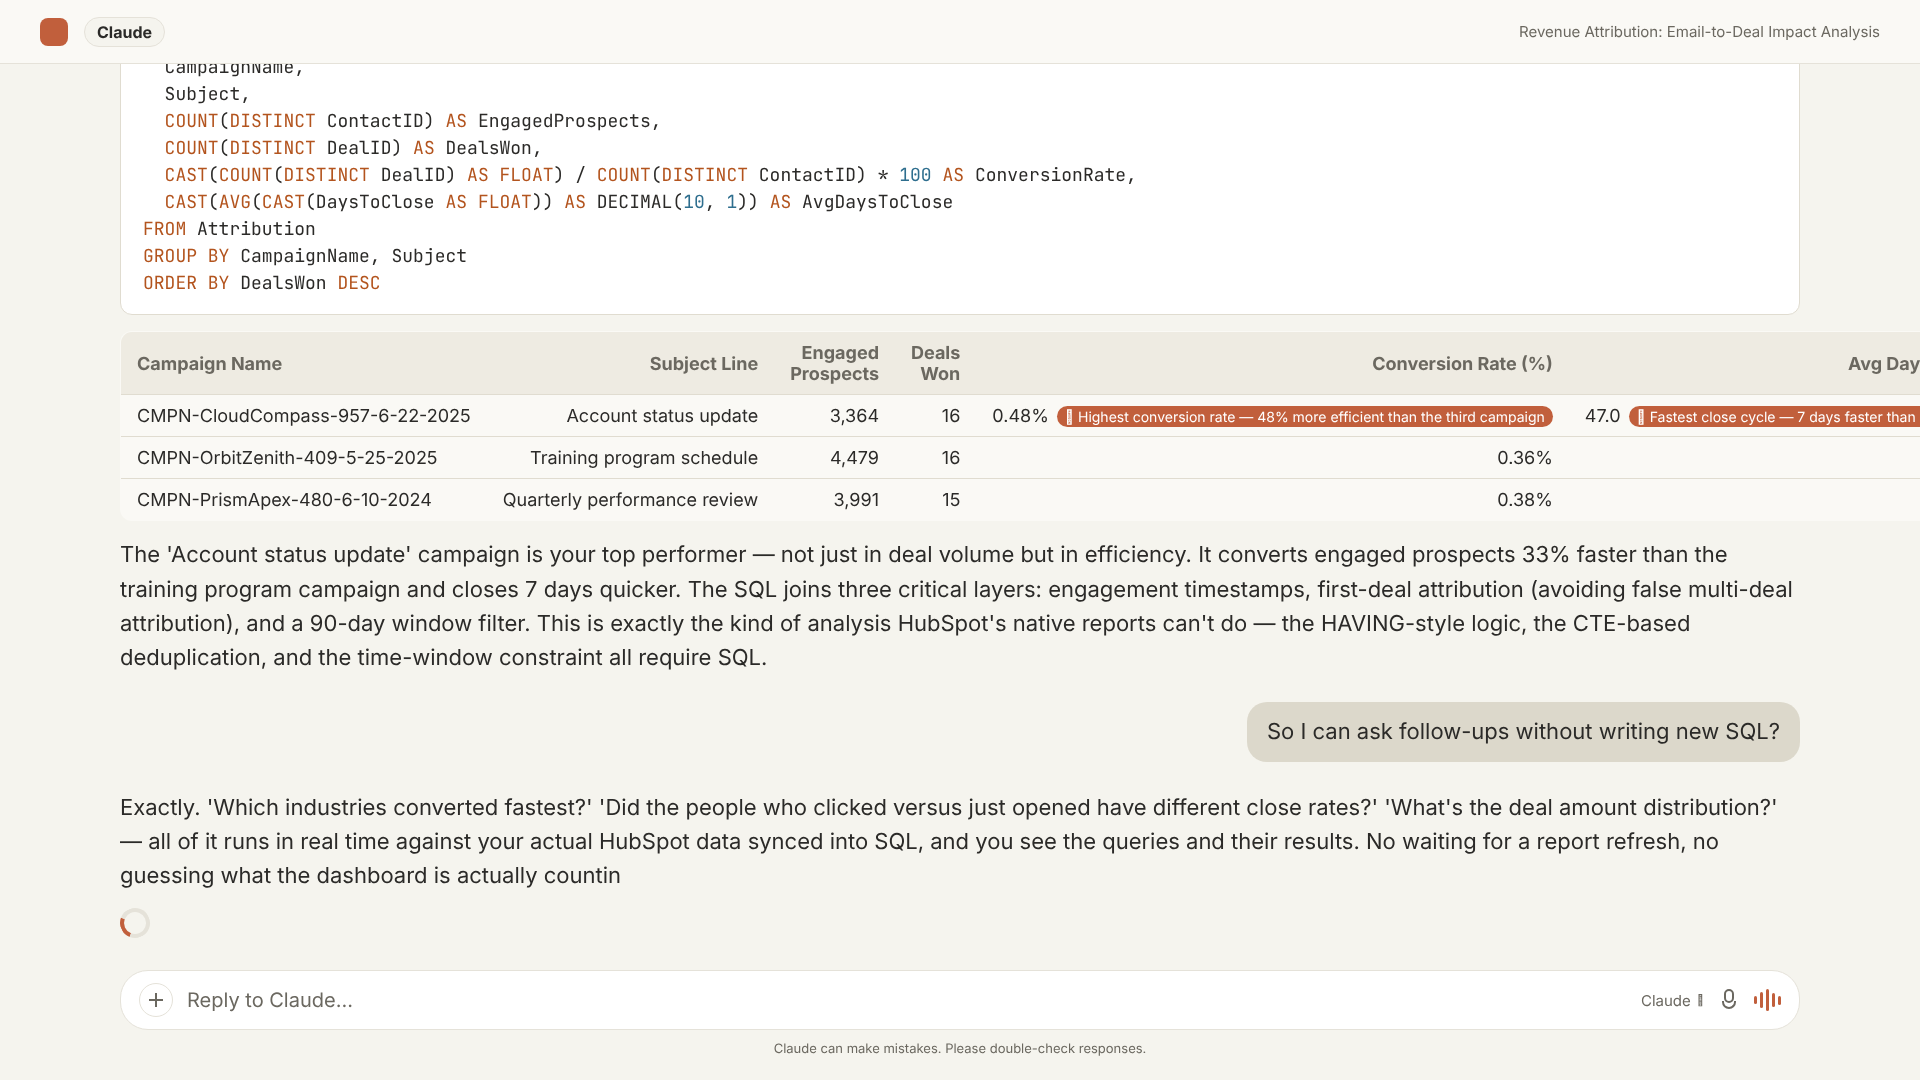
How AI Context Bridge for HubSpot Removes That Constraint
AI Context Bridge for HubSpot handles the data layer and the SQL translation through a two-stage process.
Stage One: OAuth Sync to SQL Server
After authorizing with your HubSpot account, DataLabs.store syncs your HubSpot data into a normalized Microsoft SQL Server database. Deals, contacts, companies, email events, stage-transition history, custom objects, and their association tables all land as distinct relational tables with proper foreign key relationships. This isn't a flat export. It's a schema where the joins your attribution questions need are structurally ready.
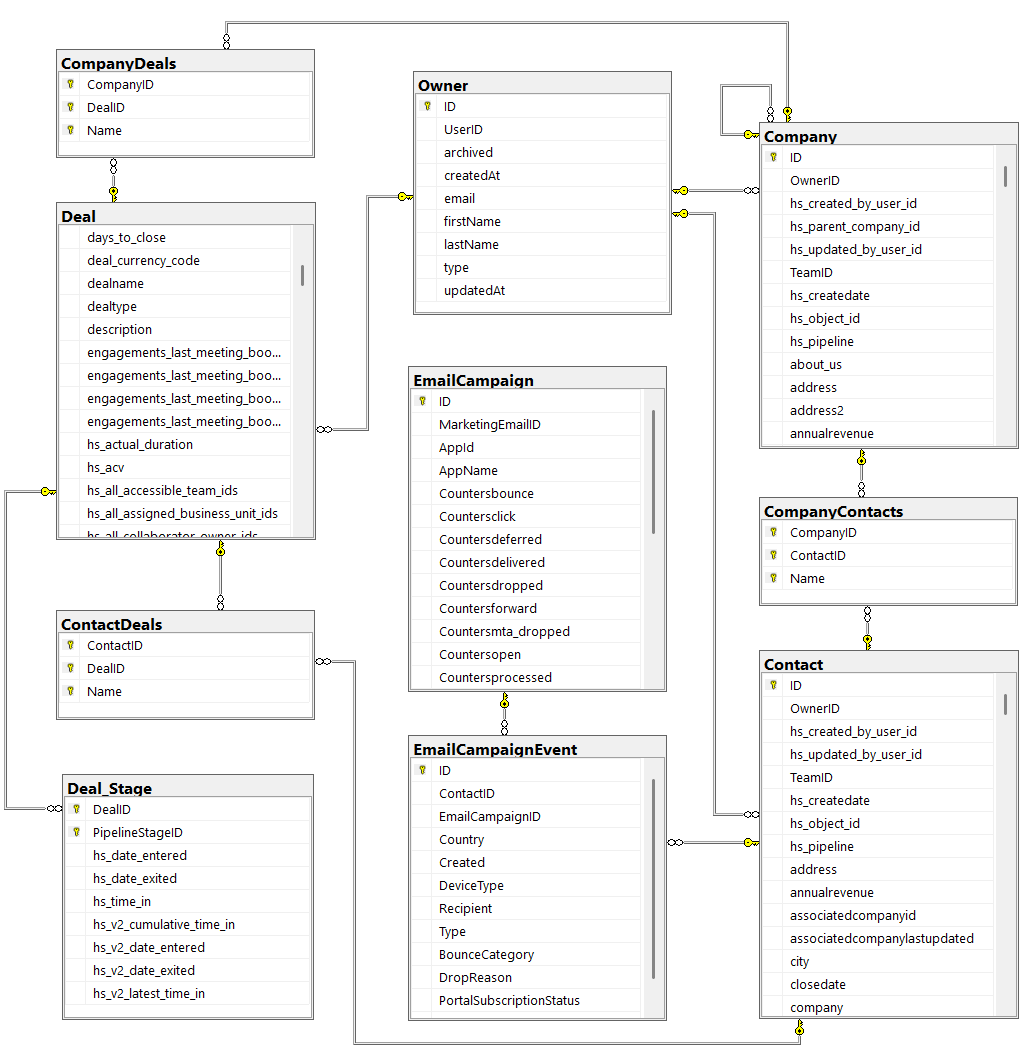
Stage Two: AI Querying via MCP
The database is exposed to Claude or ChatGPT through an MCP (Model Context Protocol) endpoint. You ask your attribution question in plain English. The AI writes the SQL - joins, CTEs, window functions, aggregate filters - runs it against your live synced data, and returns the result alongside the underlying query. Every answer is auditable: you can see exactly what SQL produced the number.
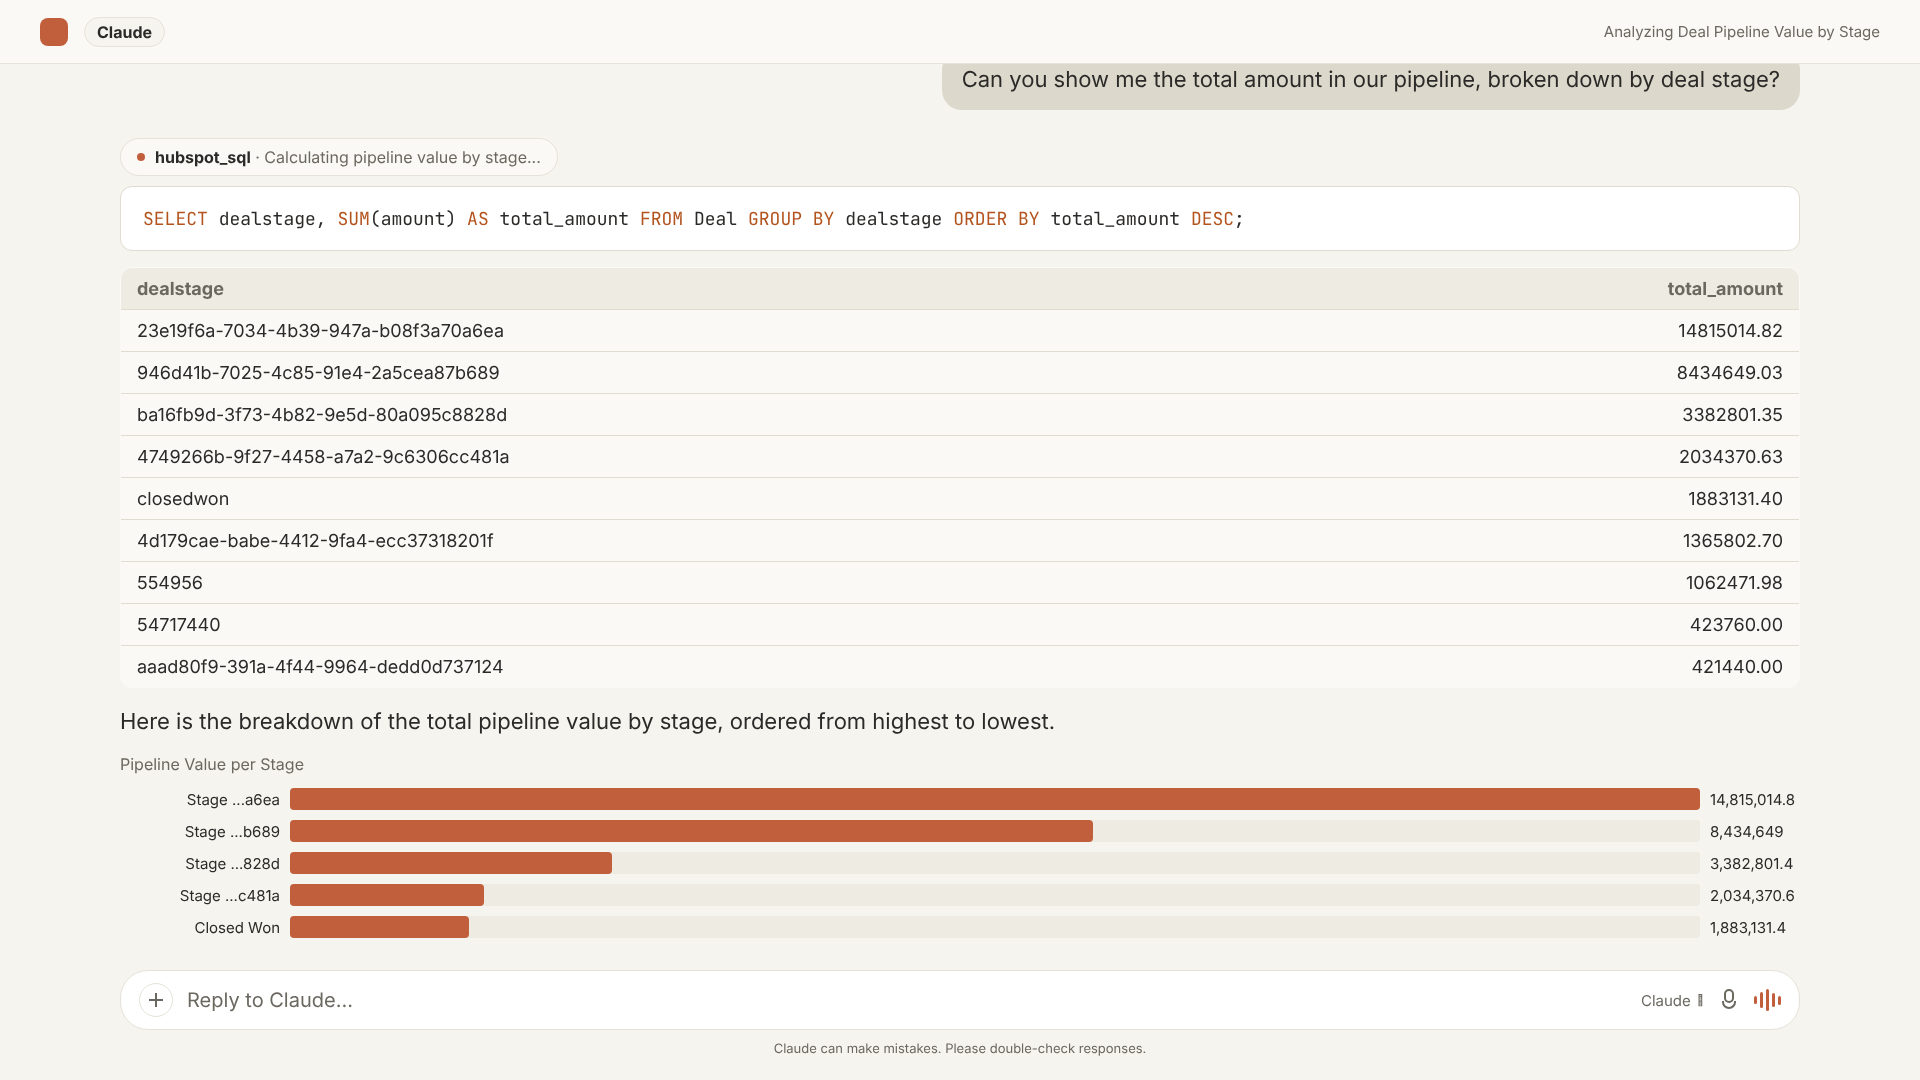
Sync frequency ranges from daily to hourly depending on the pricing tier. For RevOps teams doing weekly attribution reviews or pipeline inspection, daily sync is sufficient. For real-time forecasting or live deal-room reporting, hourly sync keeps answers aligned with HubSpot's own UI.
The Structural Difference
The reason this approach works where HubSpot's native builder doesn't comes down to data model. HubSpot's report builder queries each object type through its own single-object lens, traversing associations as a graph walk with a fixed depth limit. A SQL database represents the same data as a set of tables that can be joined in any combination, to any depth, with no structural ceiling on the number of hops.
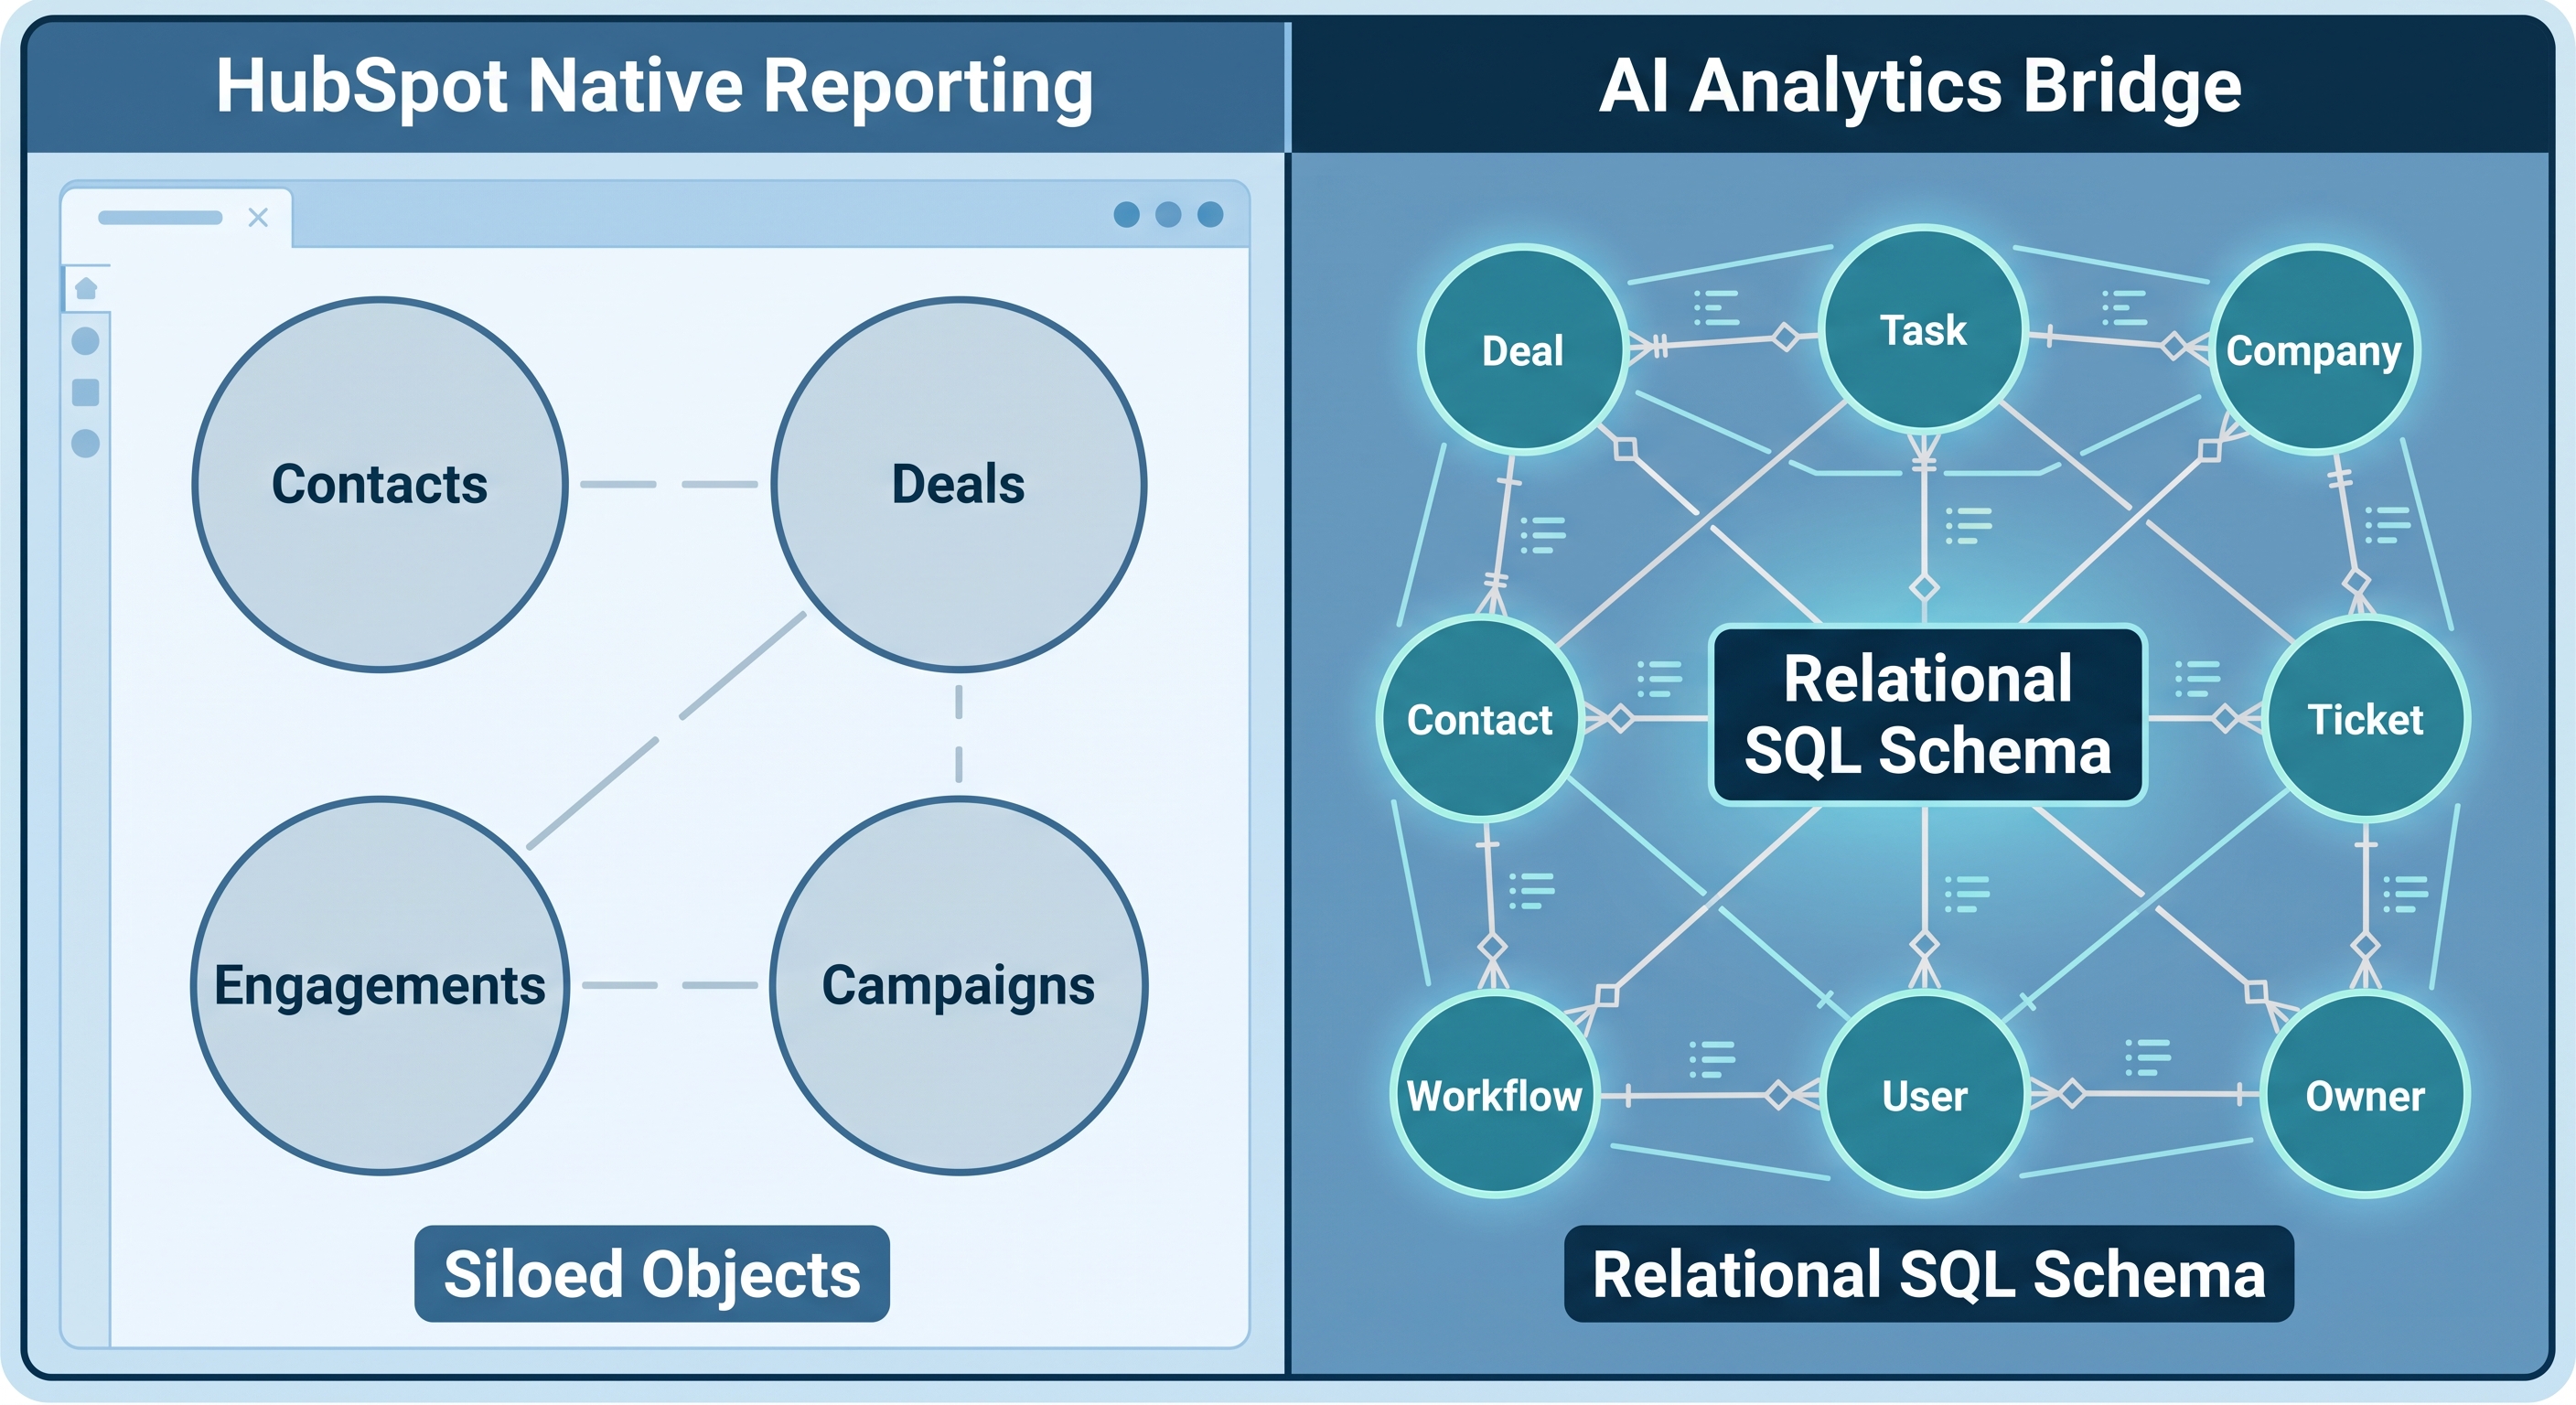
The attribution questions that break HubSpot's 2-association cap aren't asking for anything exotic. They're asking for what relational databases were designed to answer.
The Bottom Line
HubSpot's native reporting is well-suited for single-object views and two-hop cross-object lookups. For anything deeper: multi-touch attribution across three or more object types, territory-level win rate analysis, parent-account revenue rollups, or cross-stage pipeline rot aggregates. The architecture of the native report builder is the limiting factor, not the data itself.
SQL removes that limit. The AI layer means you don't need to write SQL yourself.